
Thank you for your interest in ICON – As promised, here are the full results across all six holiday-load simulation scenarios, run through the ICON Digital Wind Tunnel.
You have also been entered in to this summer’s #ICONholidays promotional giveaway.
Each scenario models the same vehicle under increasing real-world load – rooftop box, caravan, and, for scientific rigour, a very enthusiastic pet – so you can see exactly how drag builds up configuration by configuration.
Summary – Drag Coefficient by Scenario
| Scenario | Drag Coefficient (Cd) | Change vs Baseline |
|---|---|---|
| Scenario 1 – Car (baseline) | Cd = 0.279 | Reference |
| Scenario 2 – Car + rooftop box | Cd = 0.352 | +26.16% vs baseline |
| Scenario 3 – Car + rooftop box + caravan | Cd = 0.671 | +140.50% vs baseline |
| Scenario 4 – Car + pet in rear window | Cd = 0.313 | +12.19% vs baseline |
| Scenario 5 – Car + rooftop box + pet | Cd = 0.389 | +39.43% vs baseline |
| Scenario 6 – Car + rooftop box + caravan + pet | Cd = 0.690 | +147.31% vs baseline |
Note: All the Cd are computed with the same Sref=2.468m2
Scenario Details
Scenario 1 – Car (baseline)
Scenario 2 – Car + rooftop box
Scenario 3 – Car + rooftop box + caravan
Scenario 4 – Car + pet in rear window
Scenario 5 – Car + rooftop box + pet in rear window
Scenario 6 – Car + rooftop box + caravan + pet in rear window
Scenario 1 – Car (baseline)
The unloaded reference configuration. Clean, attached flow with minimal wake – the benchmark every other configuration is measured against.
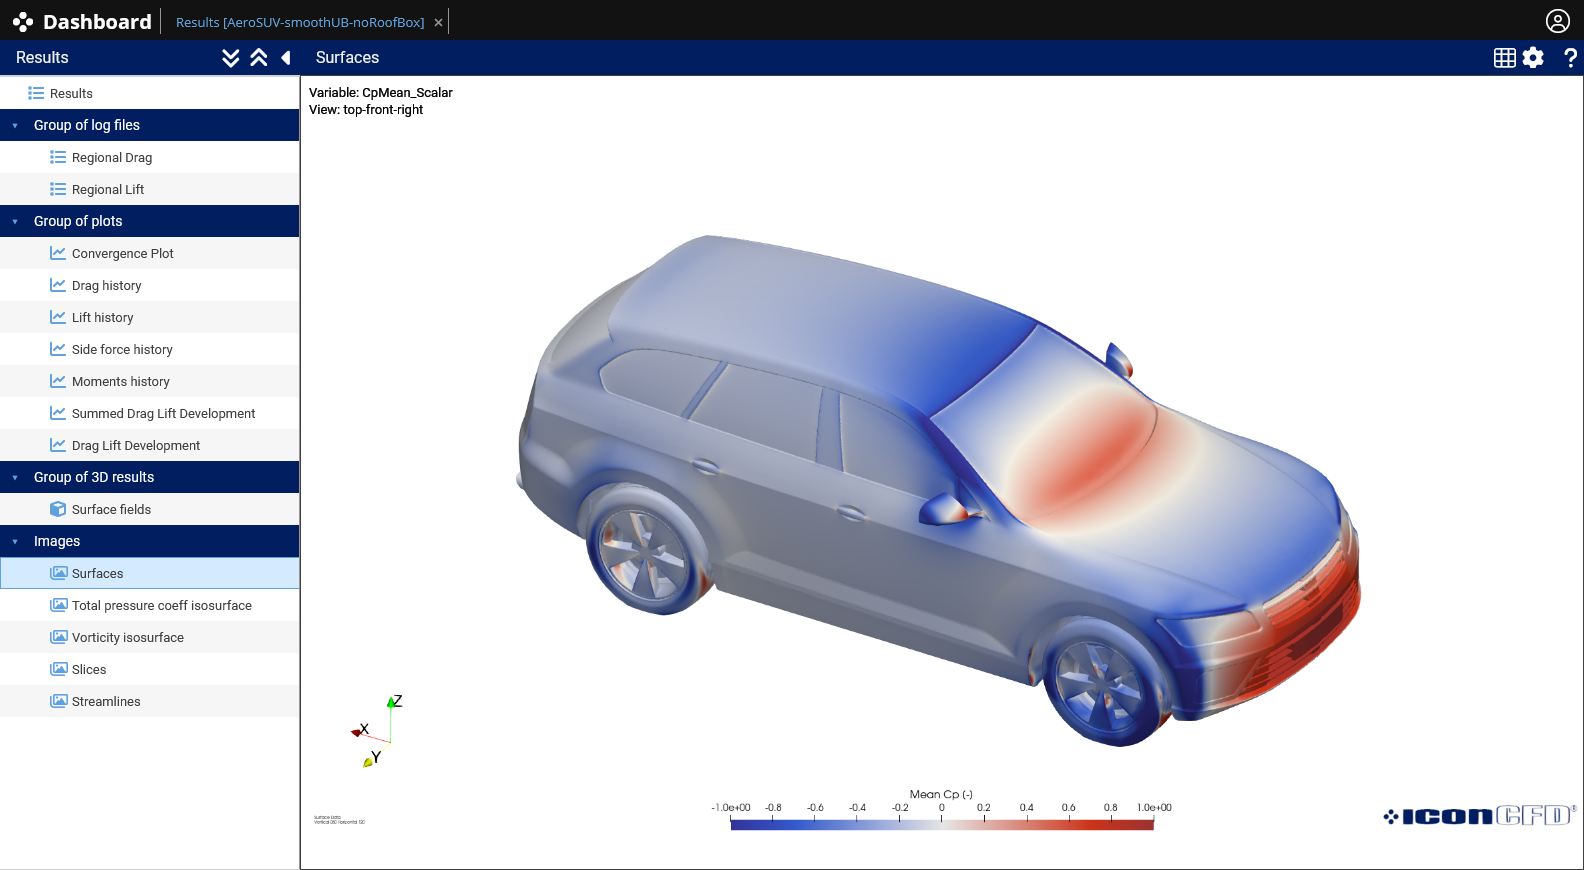
Surface pressure
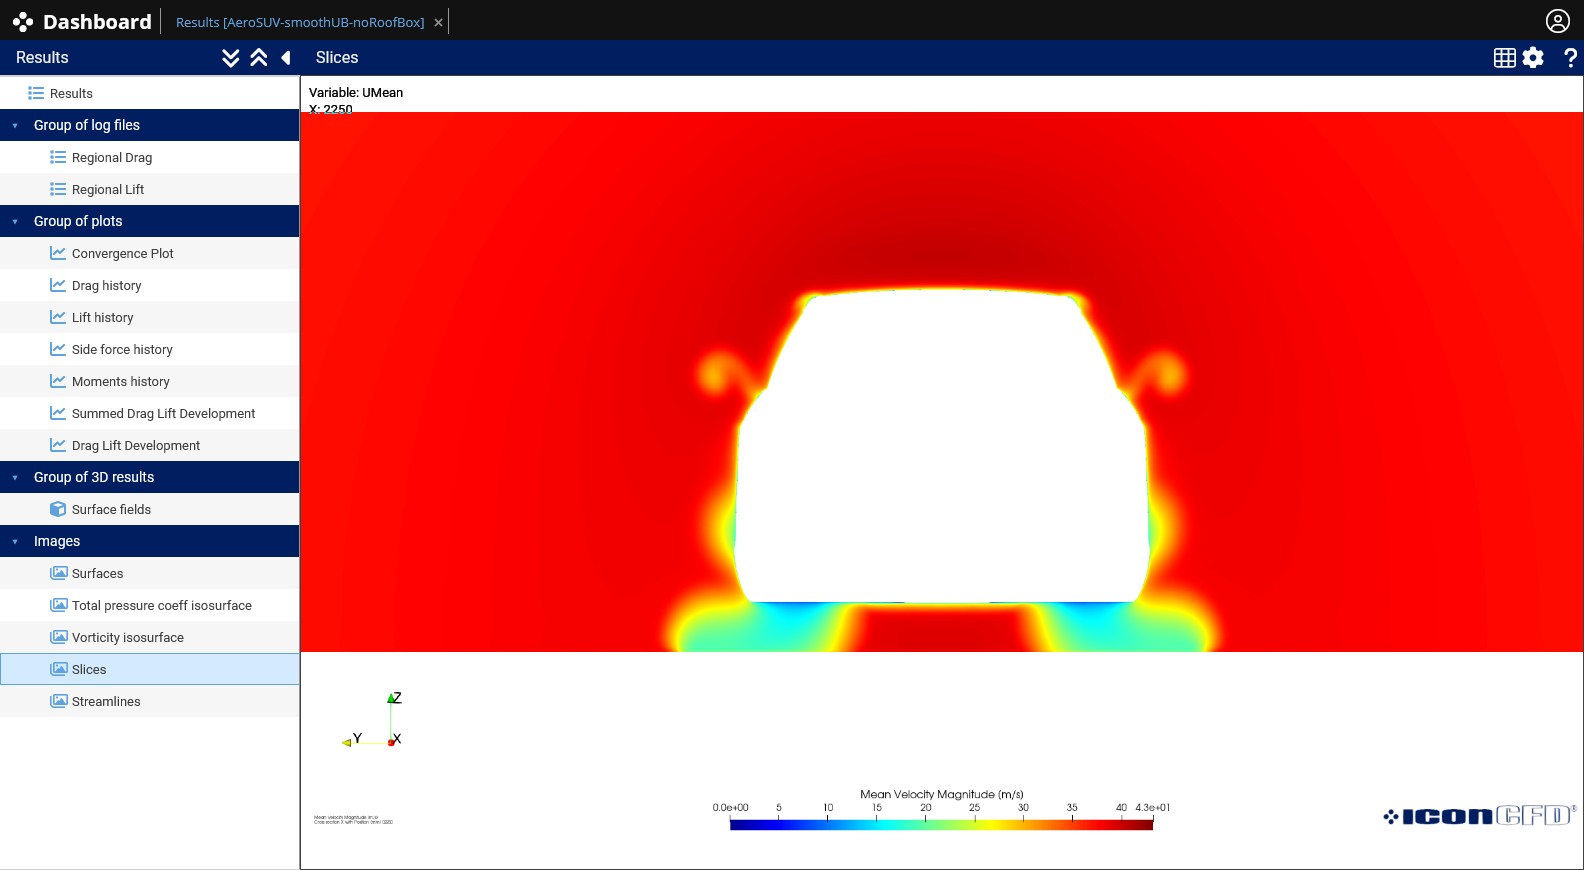
Velocity Magnitude – X Axis
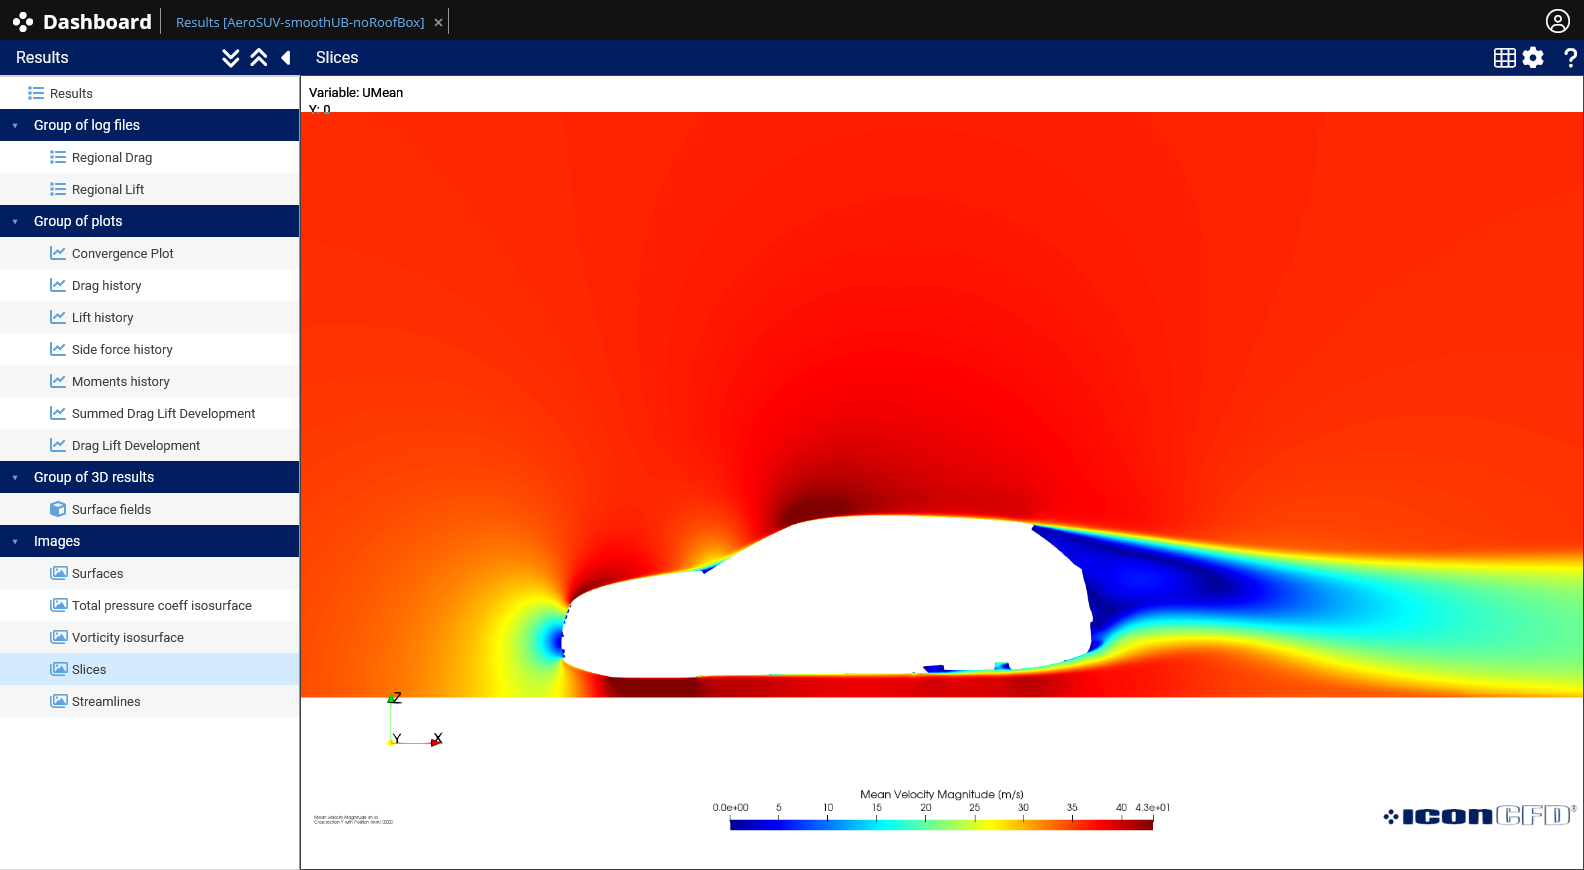
Velocity Magnitude – Y Axis (Y=0)
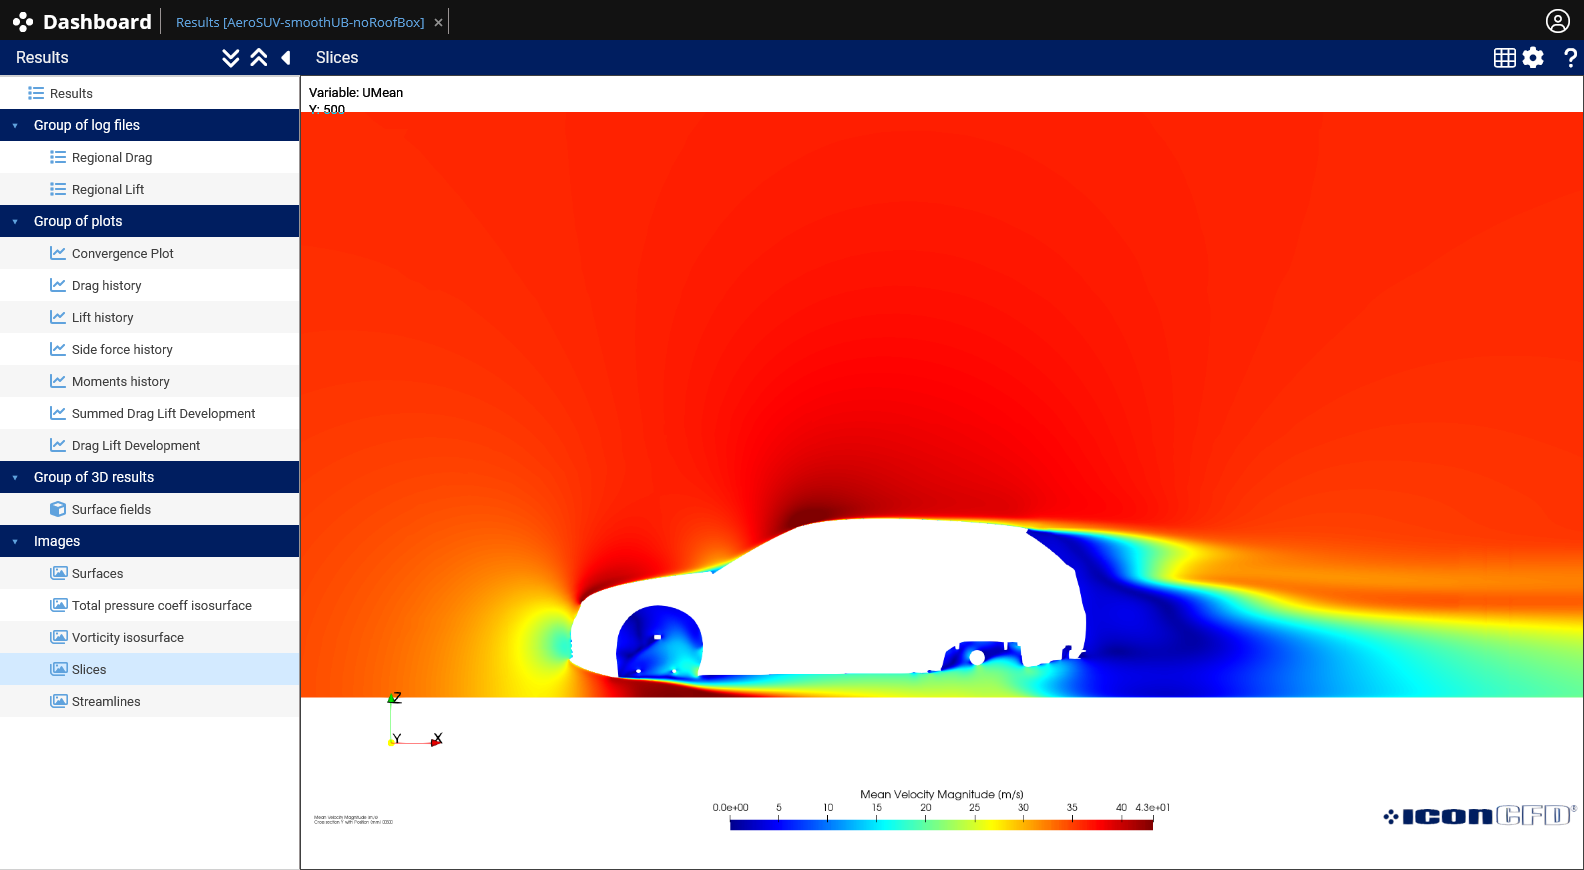
Velocity Magnitude – Y Axis (Y=500mm)
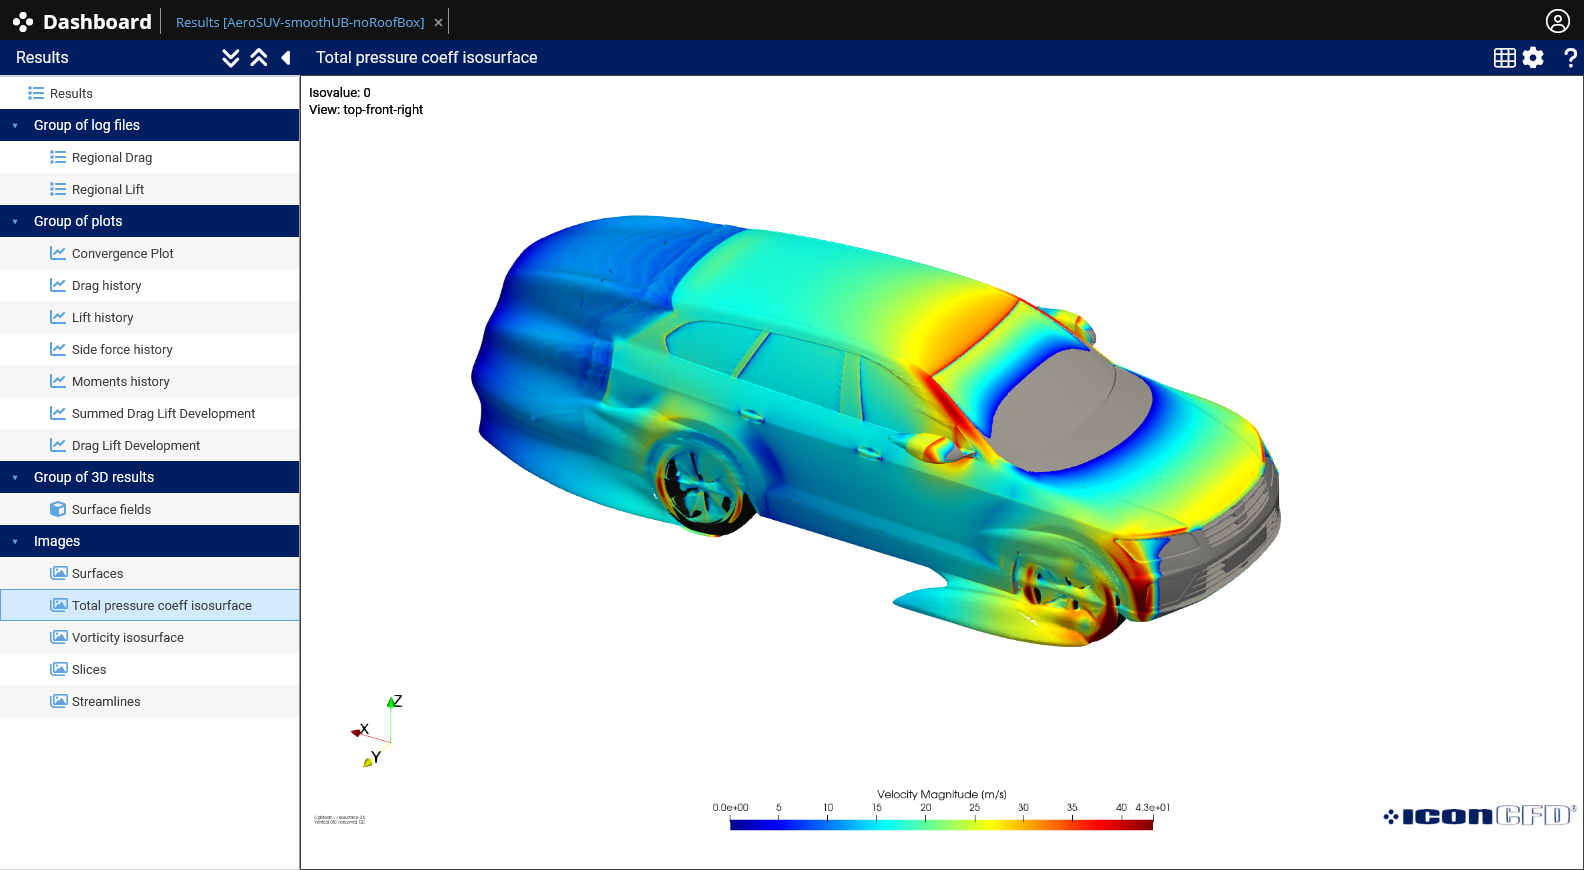
Total pressure isosurface coloured by velocity magnitude
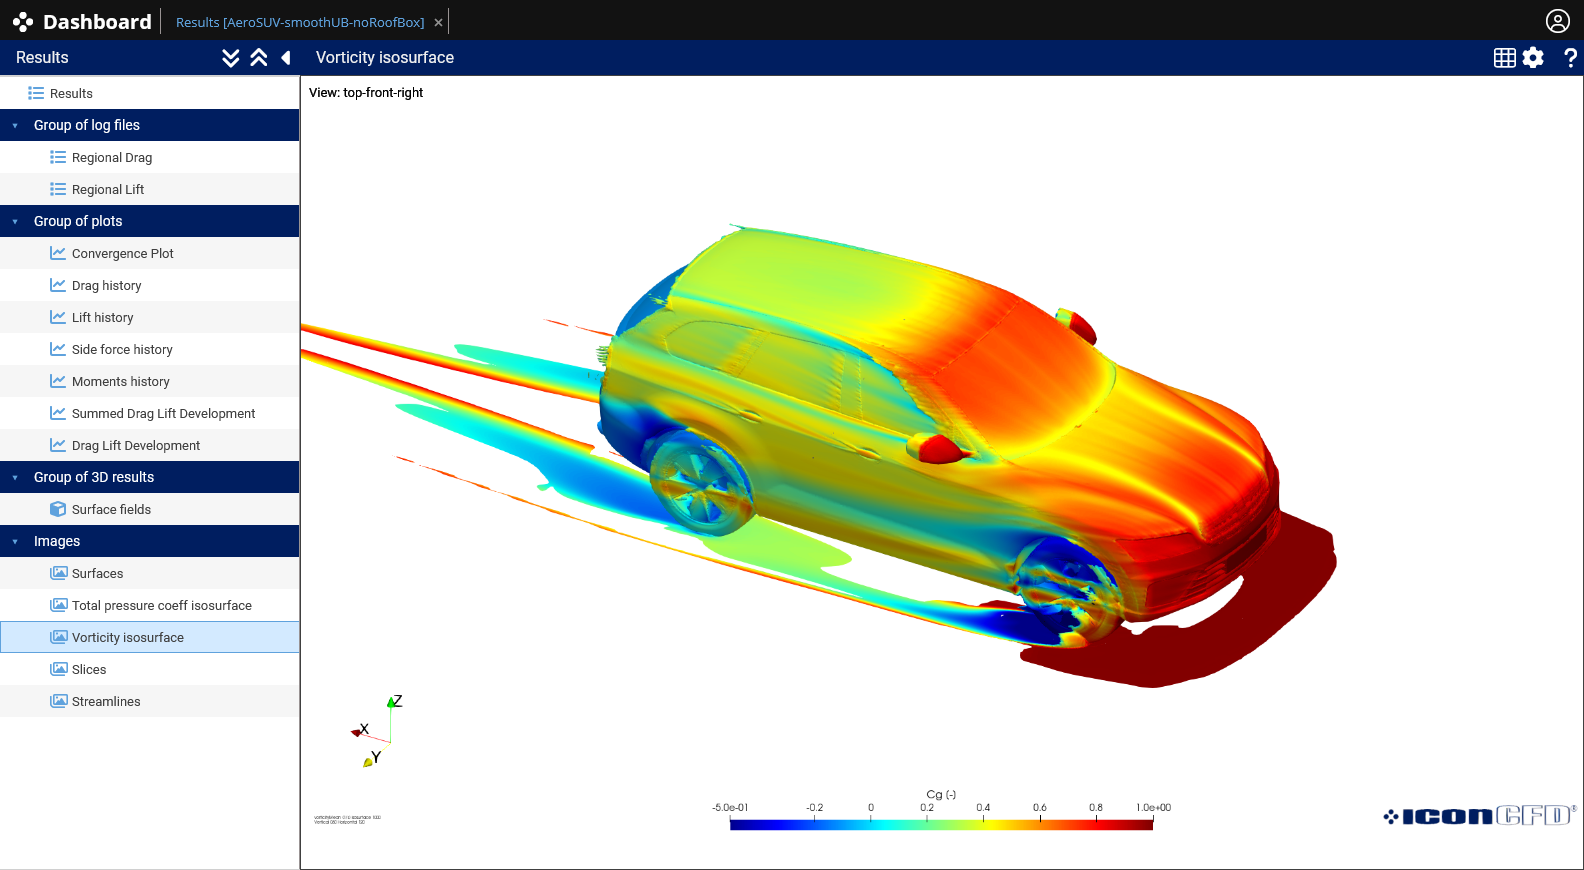
Vorticity isosurface coloured by total pressure
Scenario 1 Drag coefficient:
| Car (baseline) | Cd = 0.279 | Reference |
Scenario 2 – Car + rooftop box
Adding a rooftop box increases frontal area and introduces early flow separation ahead of the roofline, raising drag measurably above baseline.
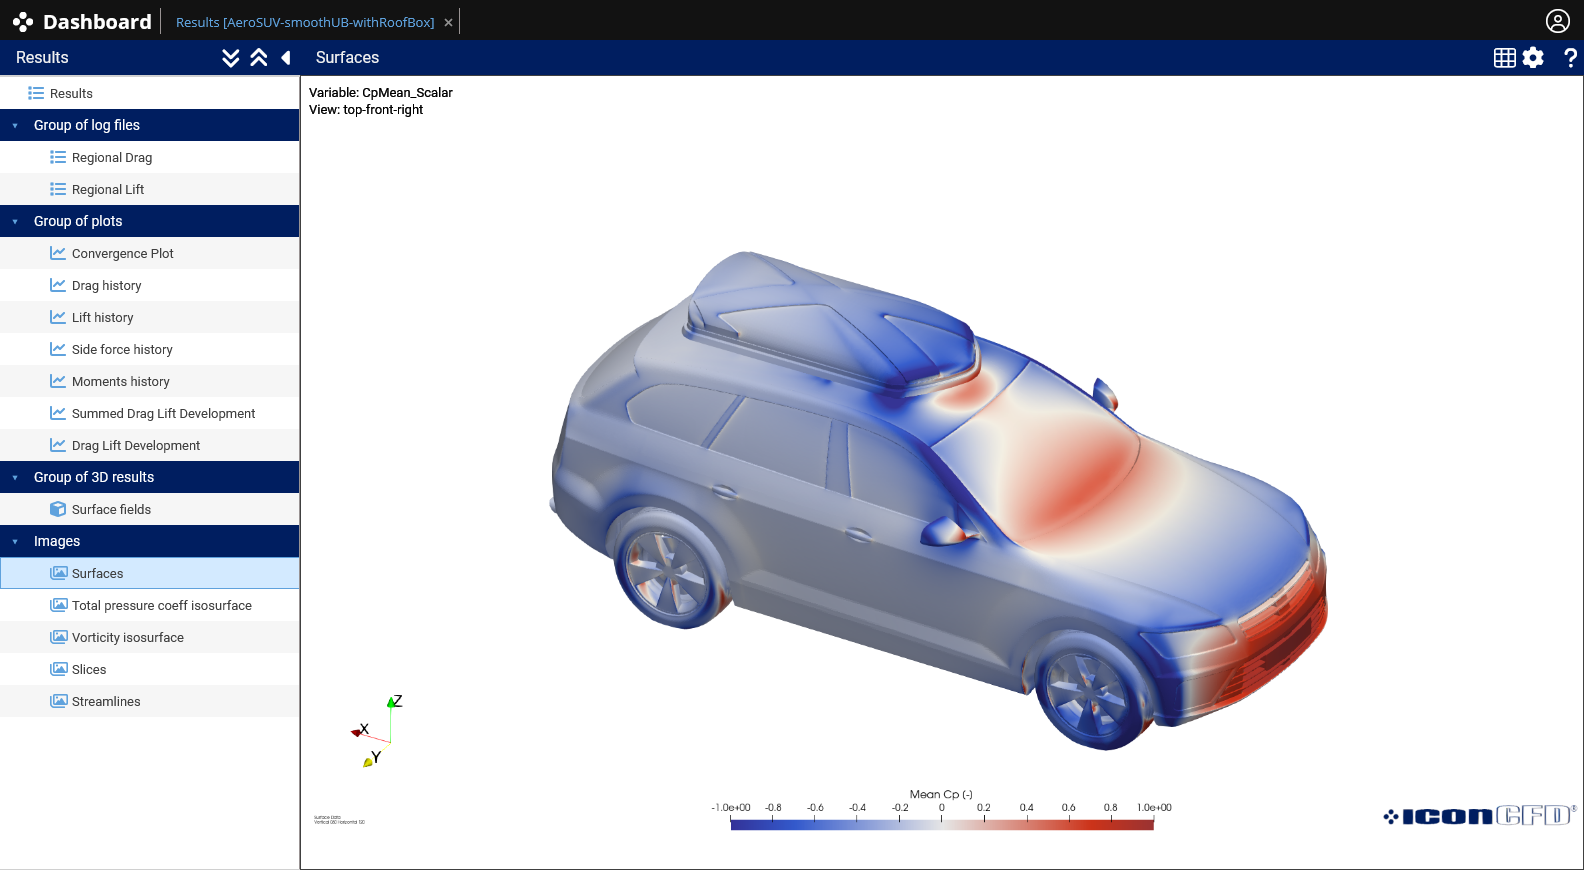
Surface pressure
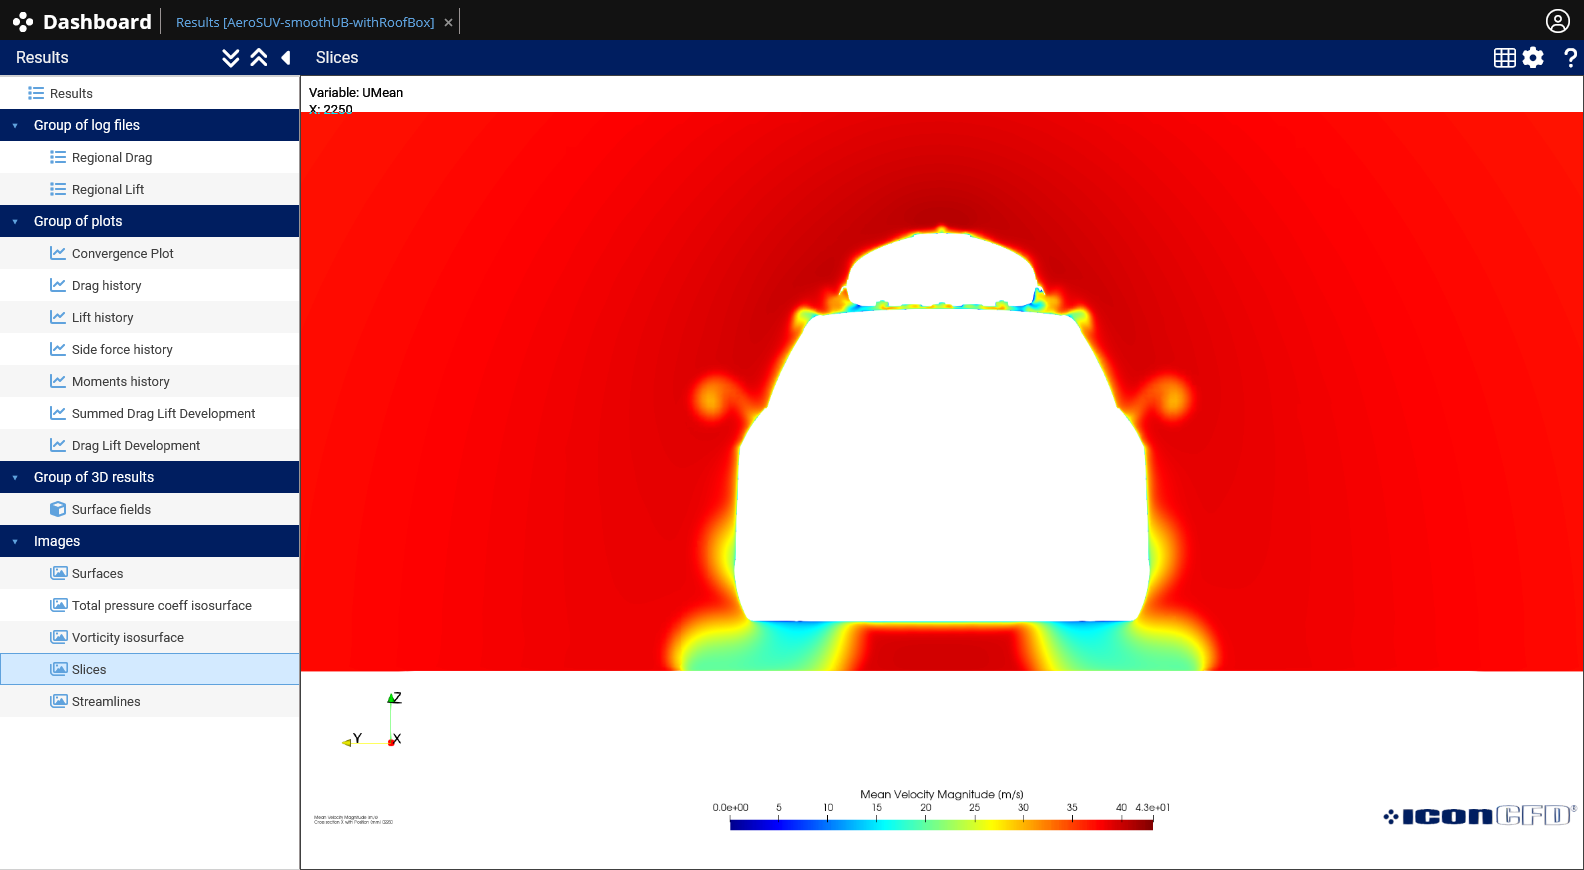
Velocity Magnitude – X Axis
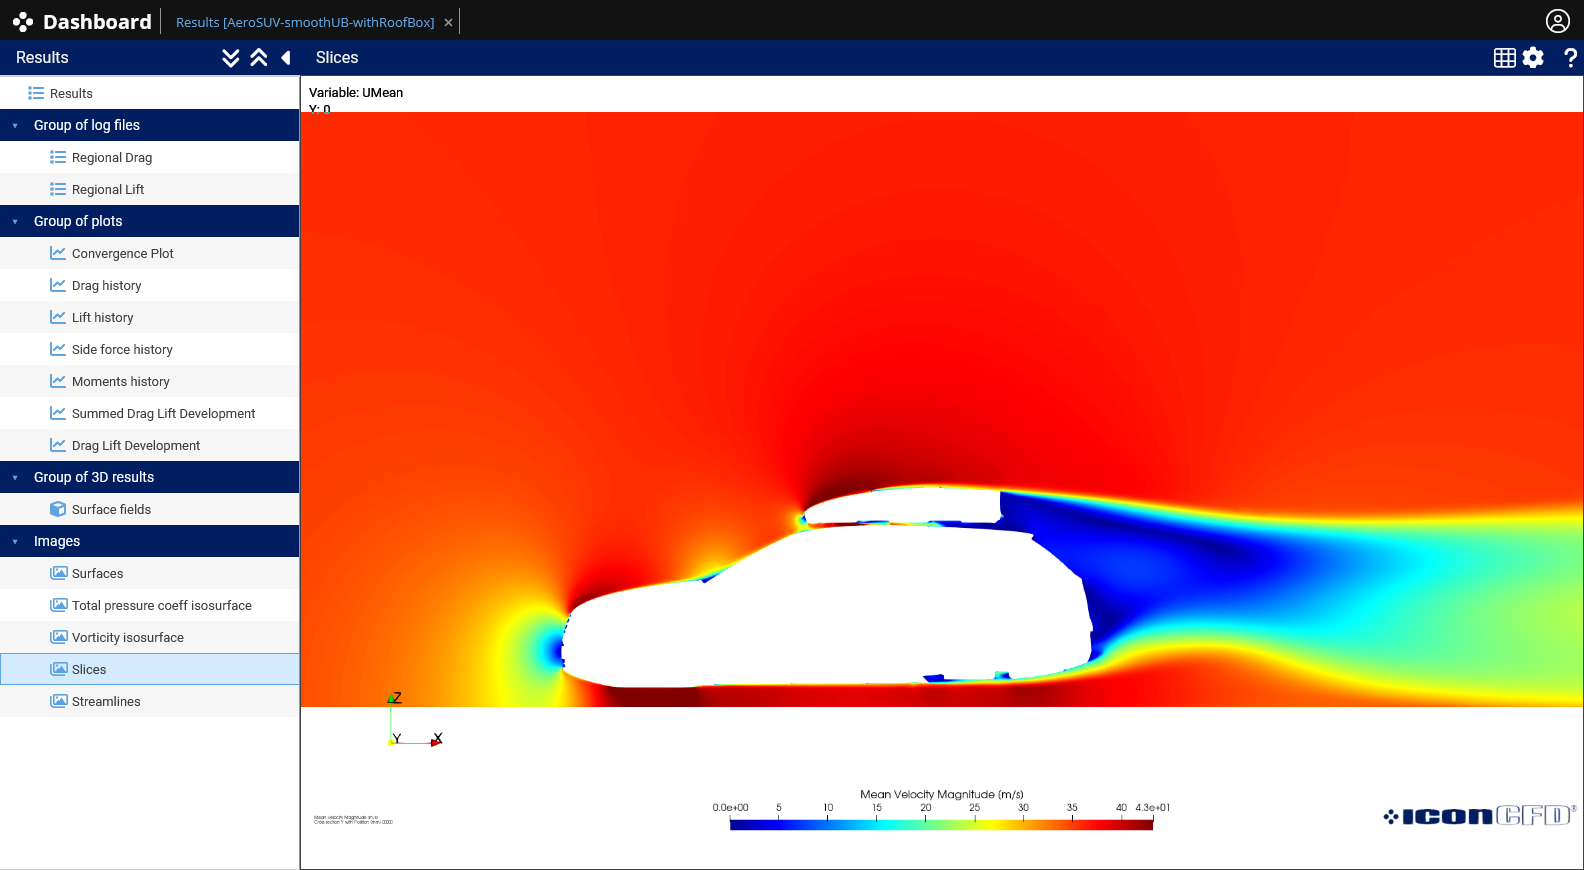
Velocity Magnitude – Y Axis (Y=0)
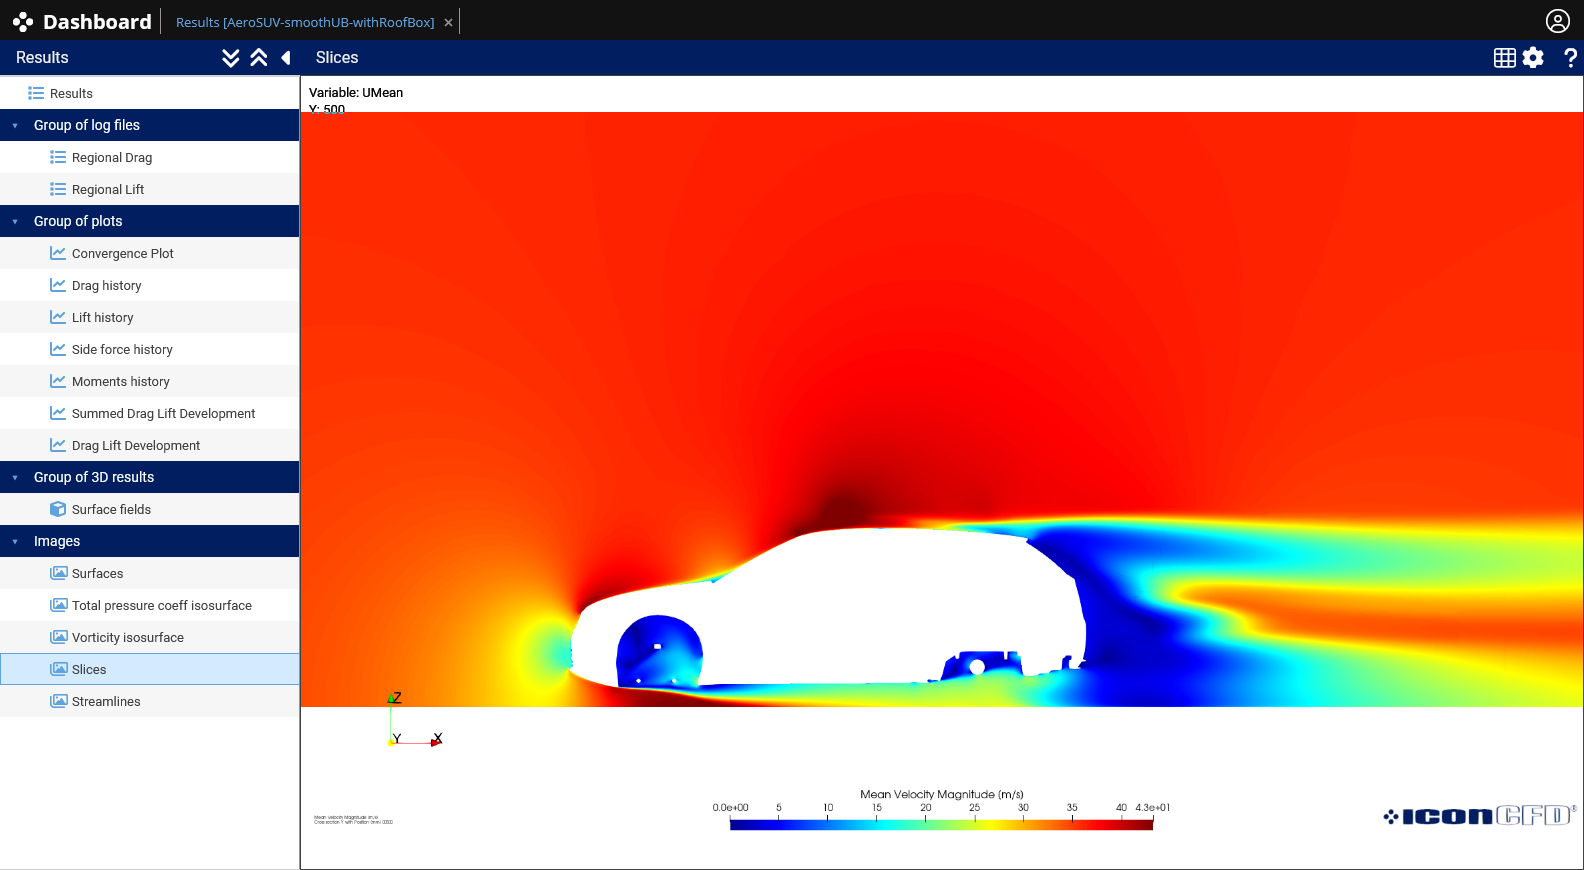
Velocity Magnitude – Y Axis (Y=500mm)
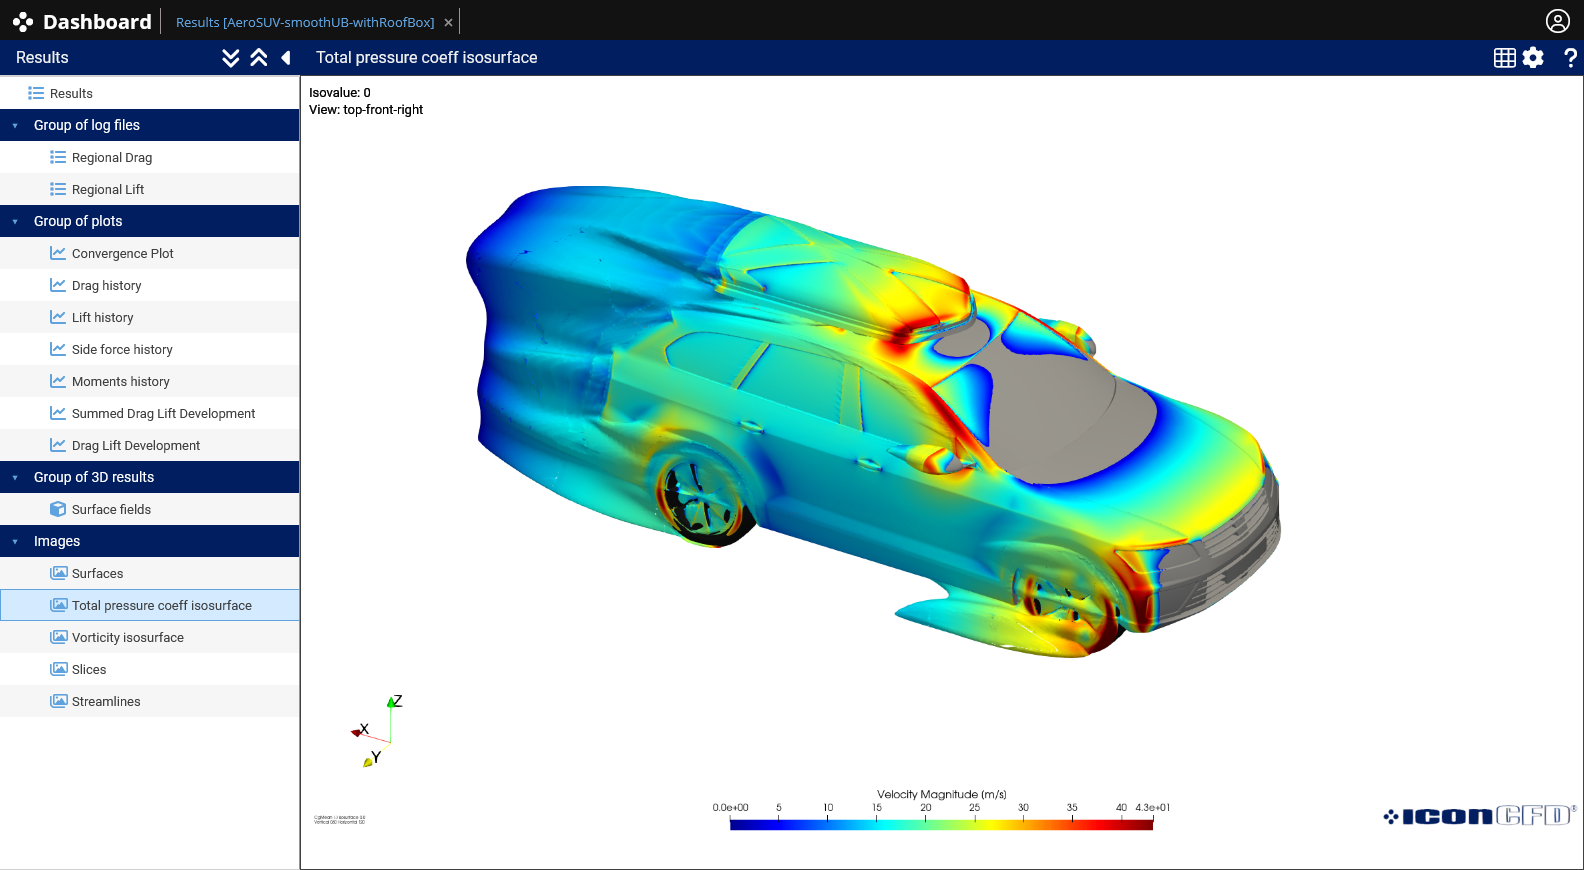
Total pressure isosurface coloured by velocity magnitude
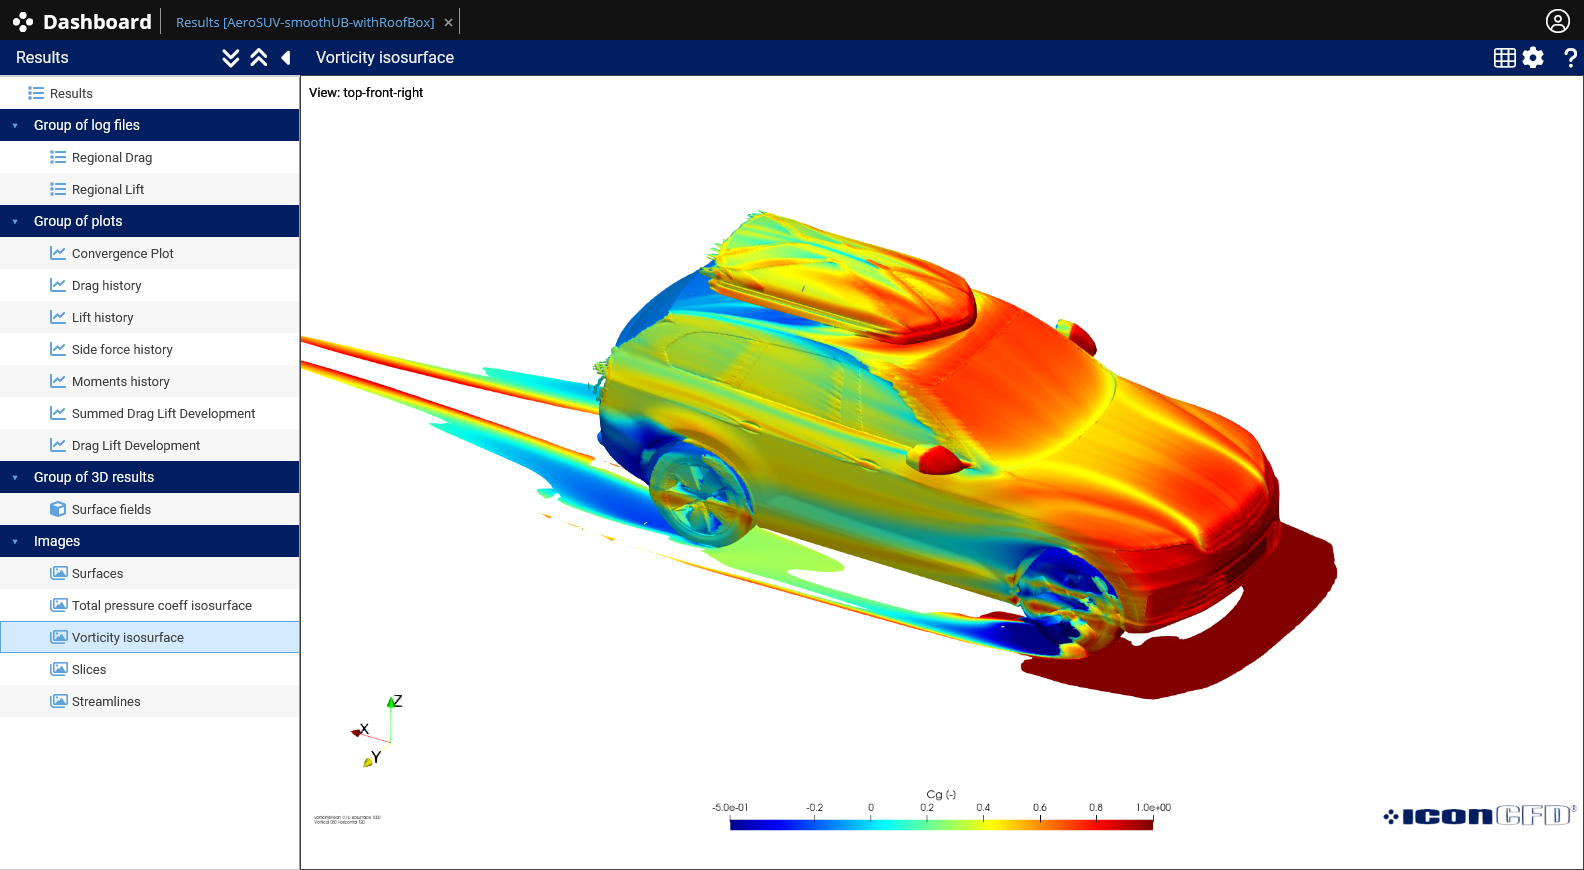
Vorticity isosurface coloured by total pressure
Scenario 2 Drag coefficient:
| Car + rooftop box | Cd = 0.352 | +26.16% vs baseline |
Scenario 3 – Car + rooftop box + caravan
The full towing configuration. Two interacting wakes – from the car and from the caravan’s leading edge – make this the most complex flow field in the series.
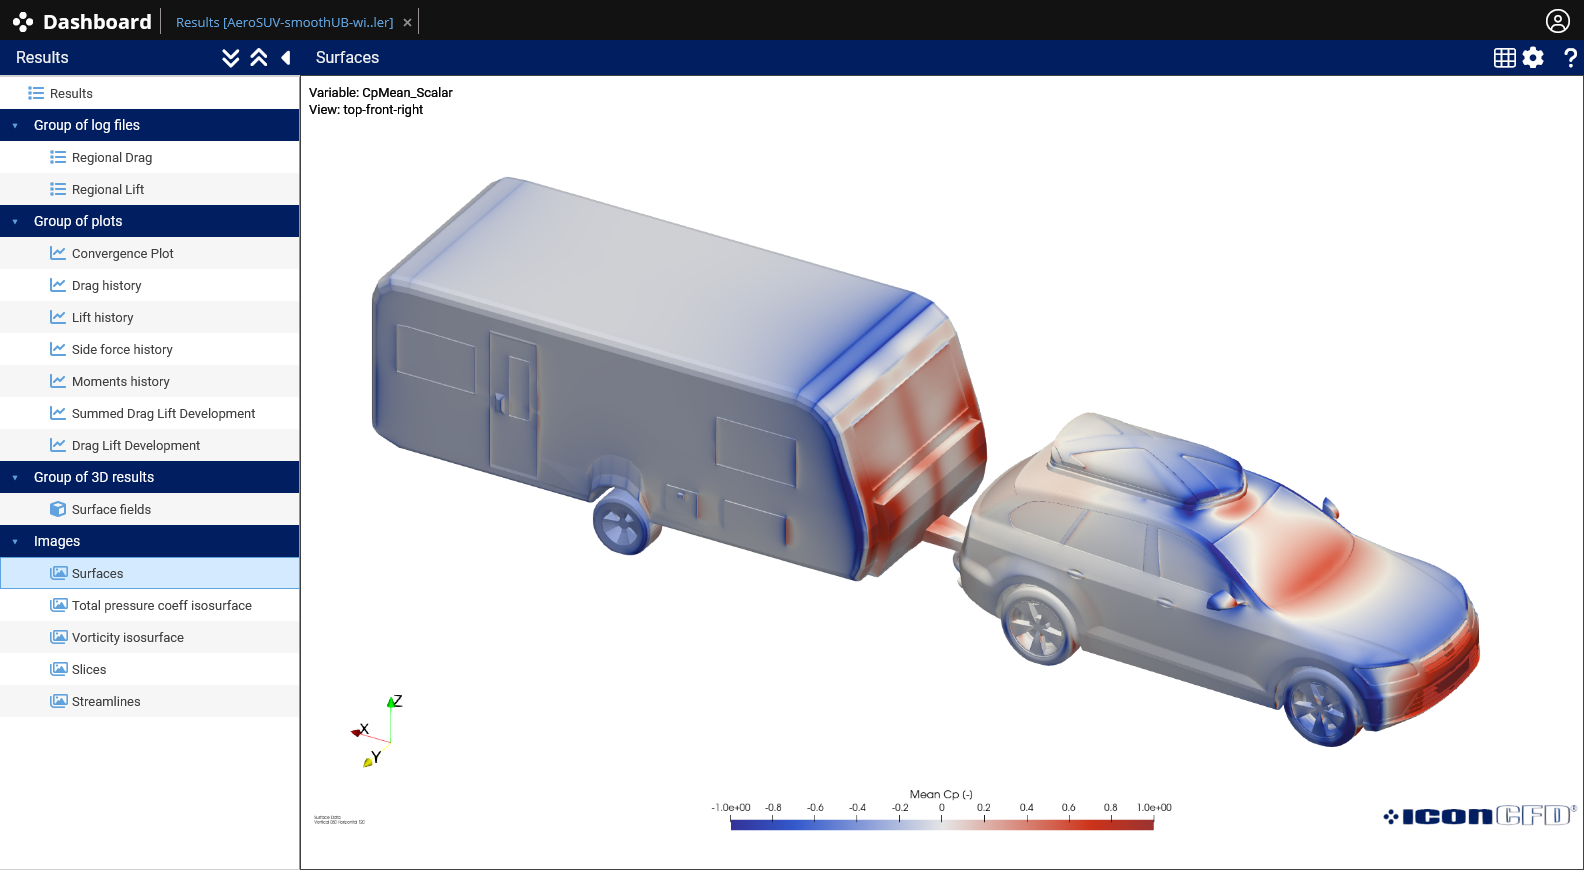
Surface pressure
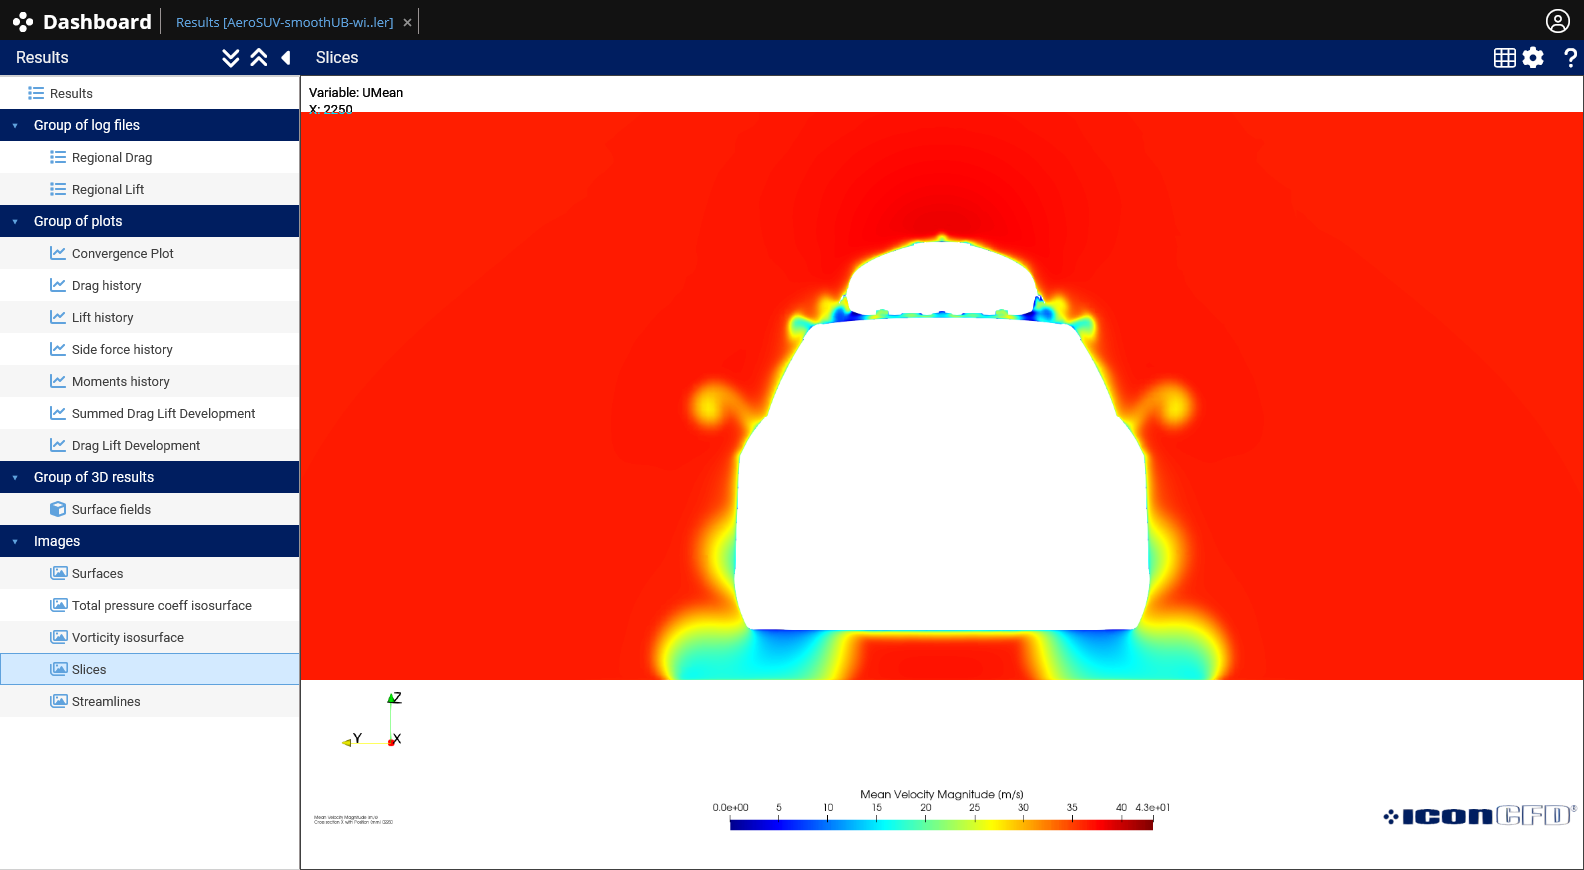
Velocity Magnitude – X Axis
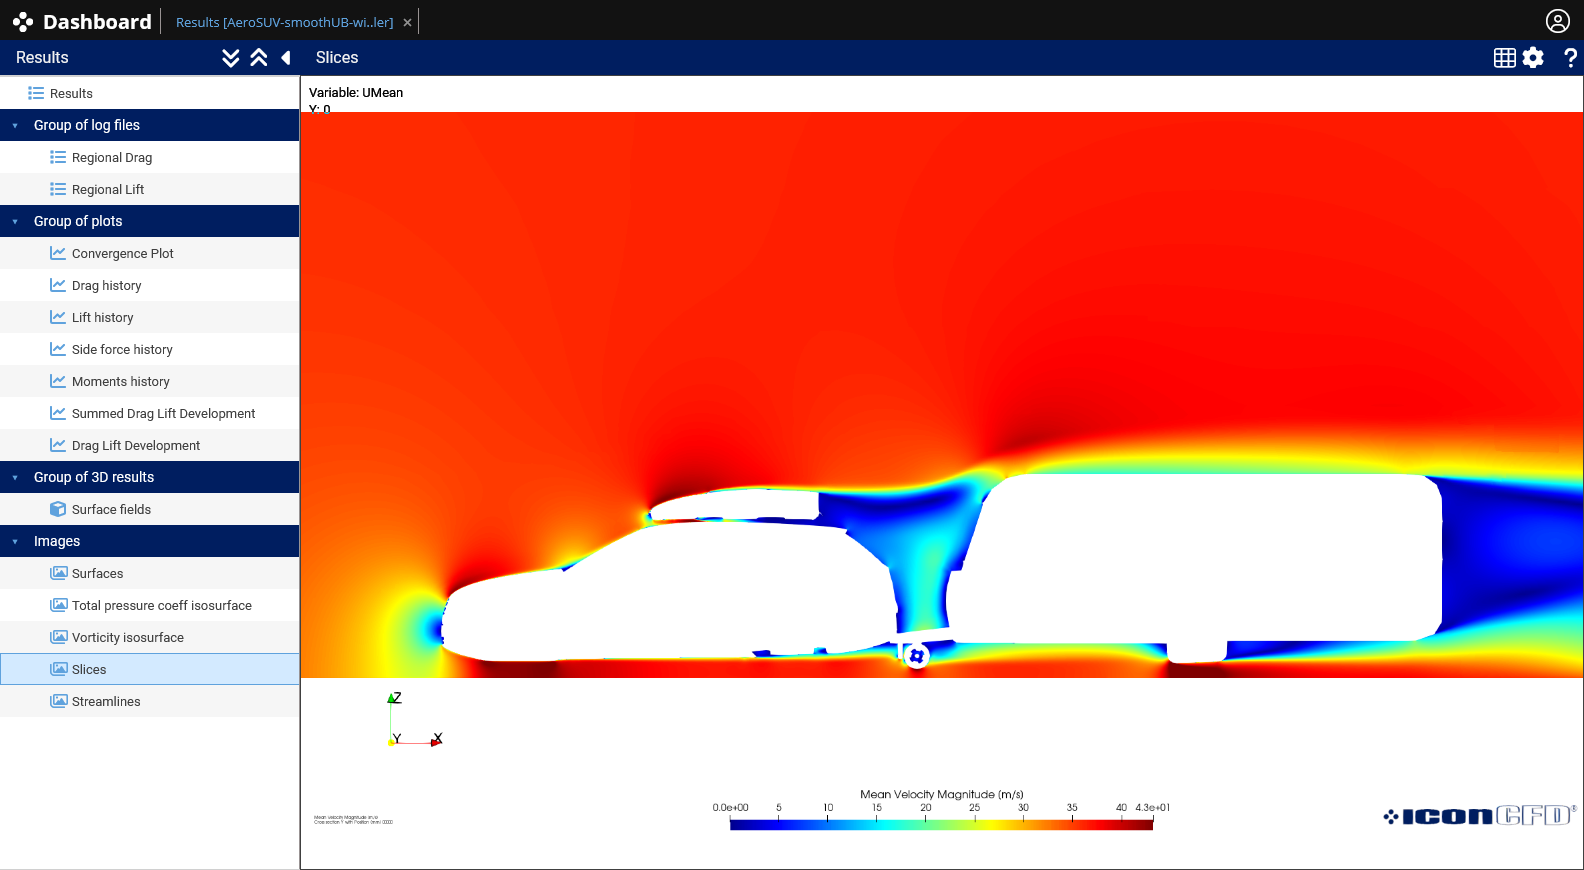
Velocity Magnitude – Y Axis (Y=0)
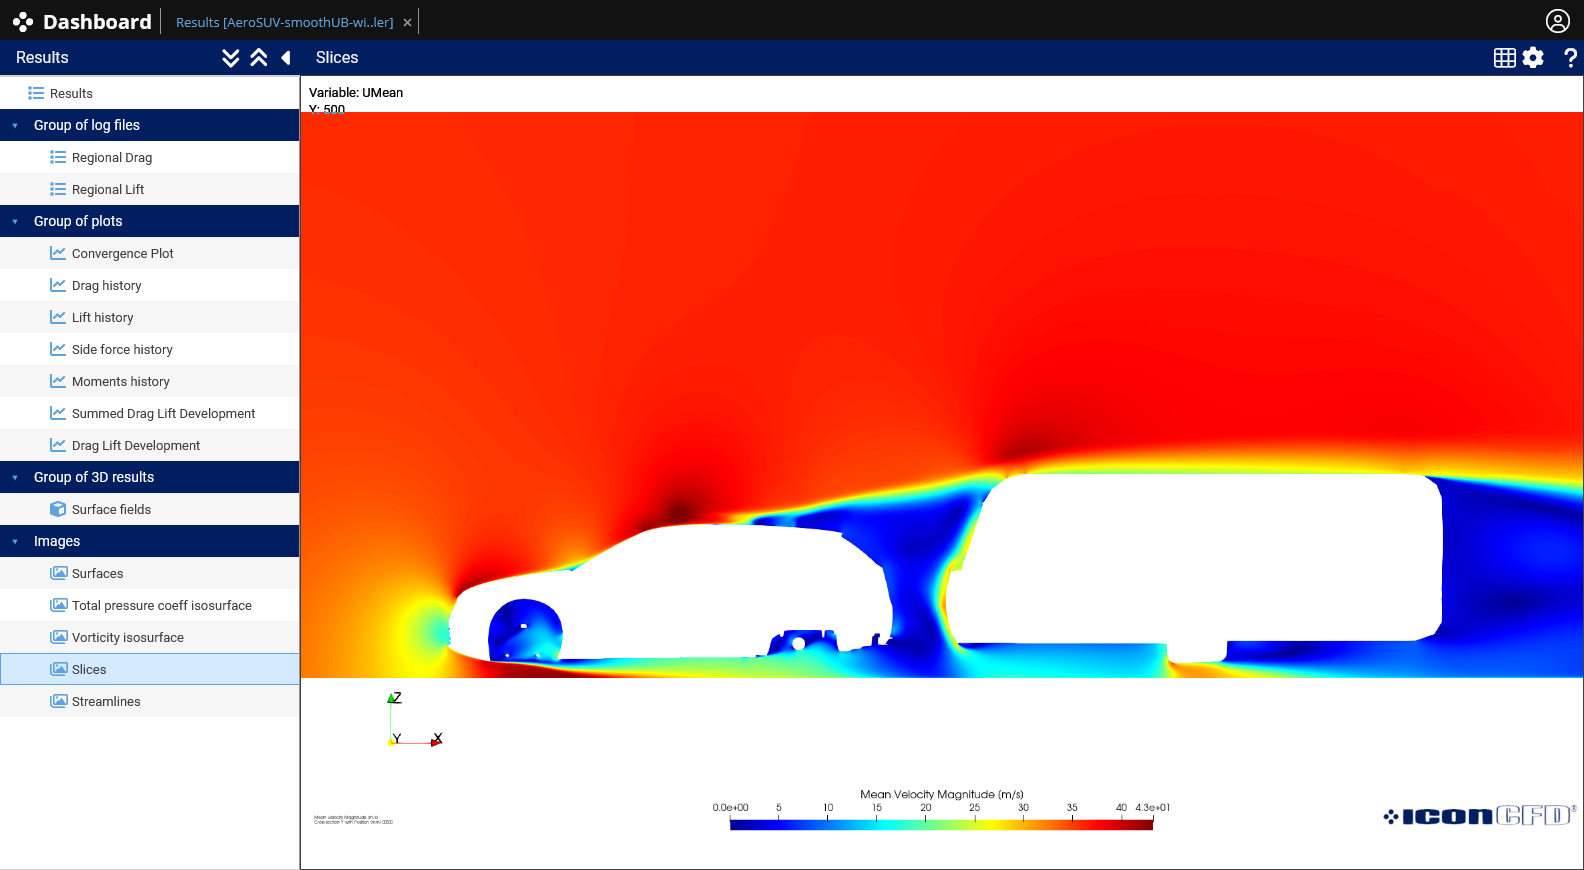
Velocity Magnitude – Y Axis (Y=500mm)
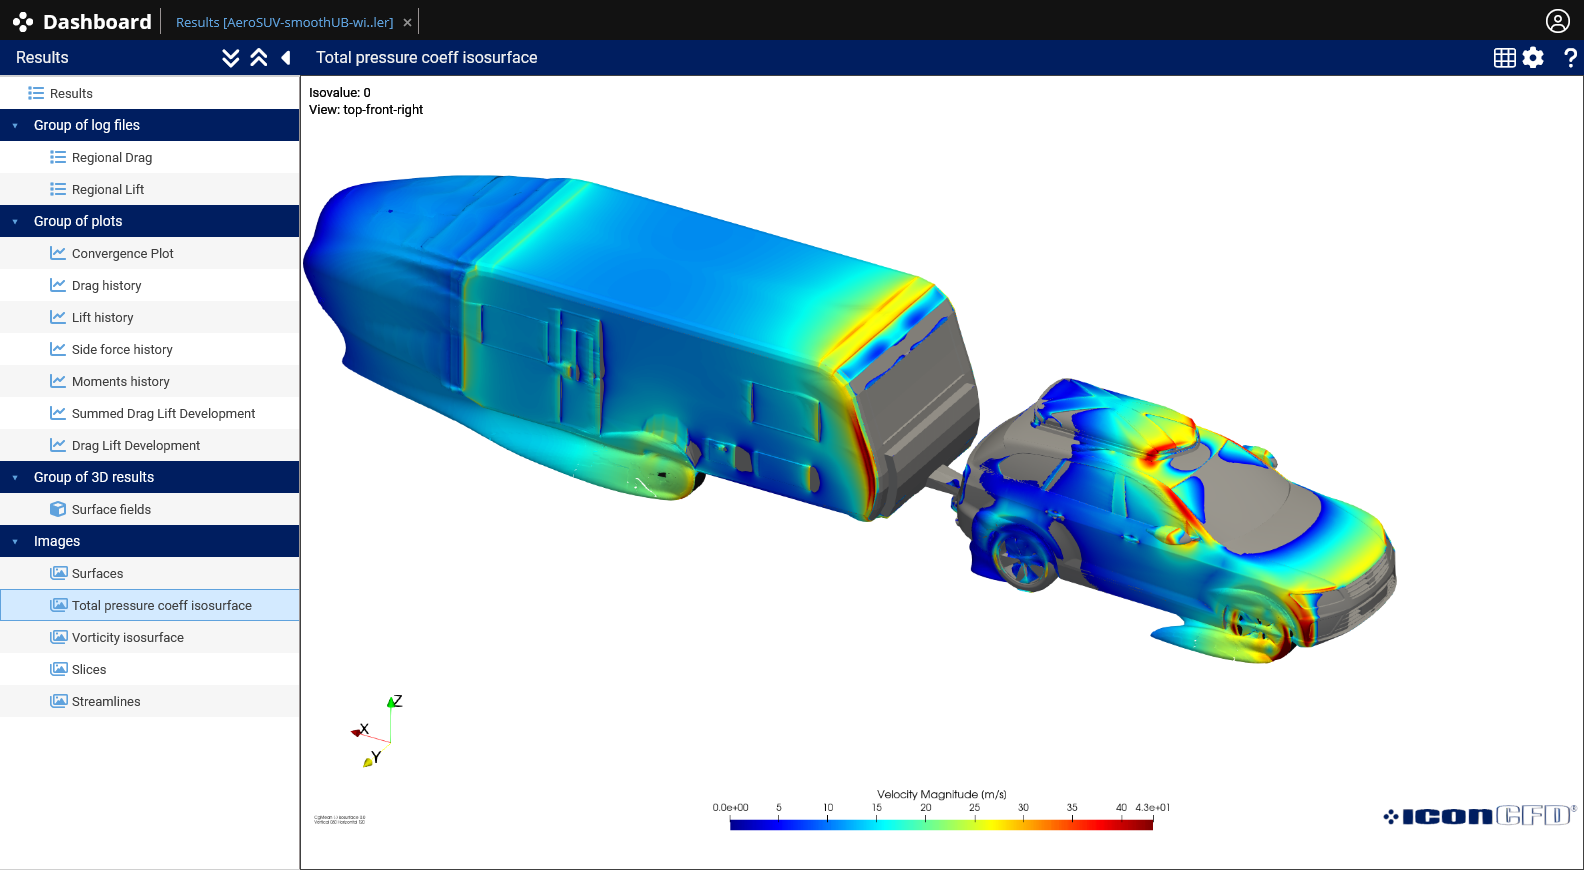
Total pressure isosurface coloured by velocity magnitude
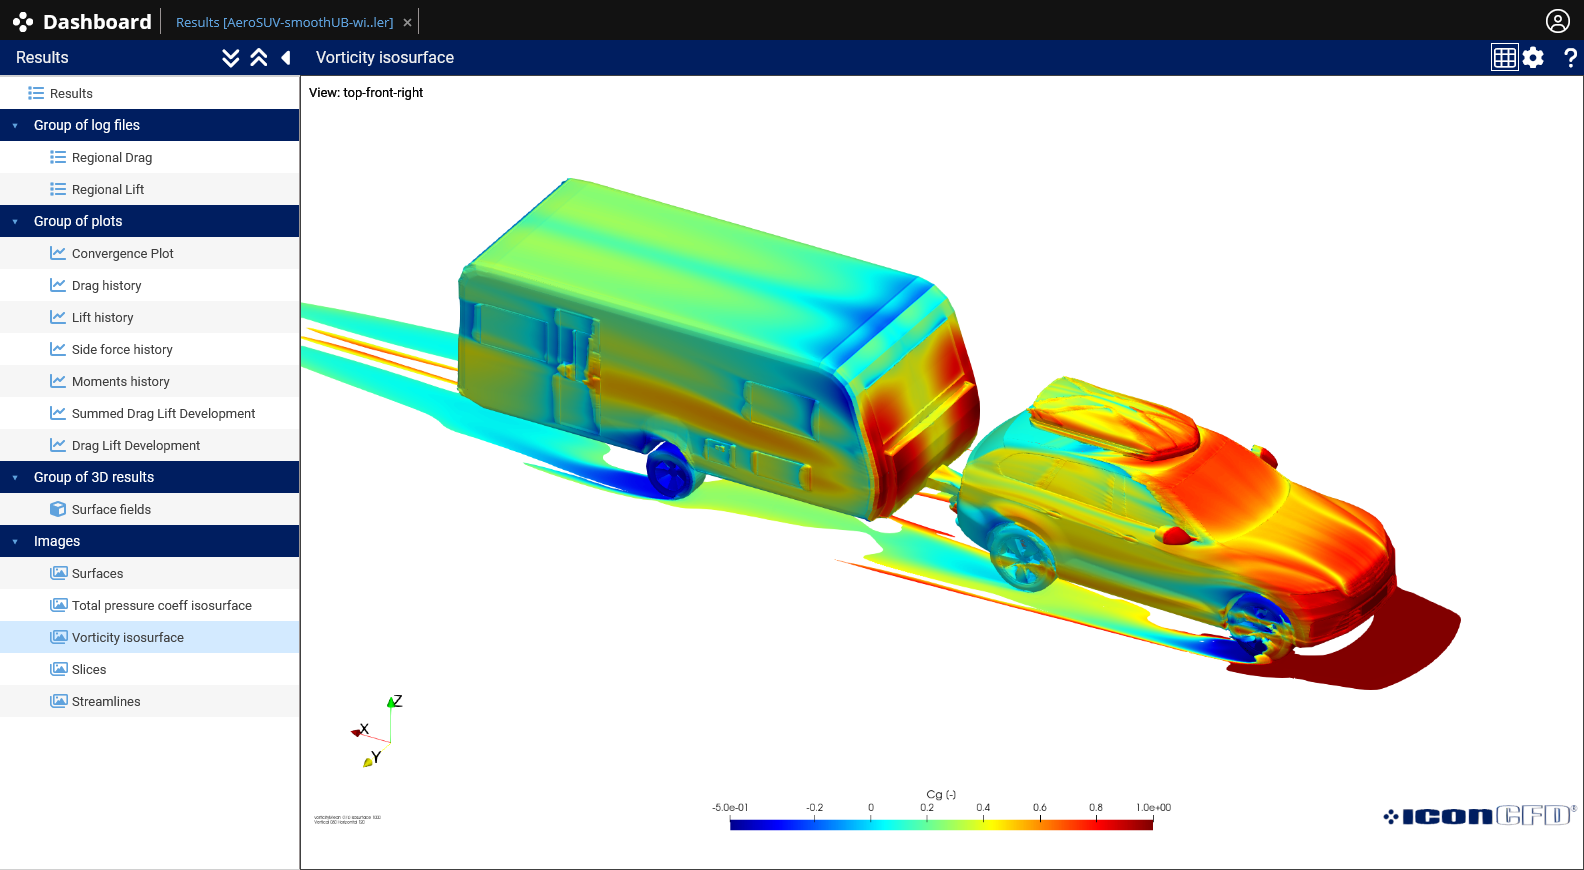
Vorticity isosurface coloured by total pressure
Scenario 3 Drag coefficient:
| Car + rooftop box + caravan | Cd = 0.671 | +140.50% vs baseline |
Scenario 4 – Car + pet in rear window
The baseline car with a small, localized flow disturbance introduced at the rear window.
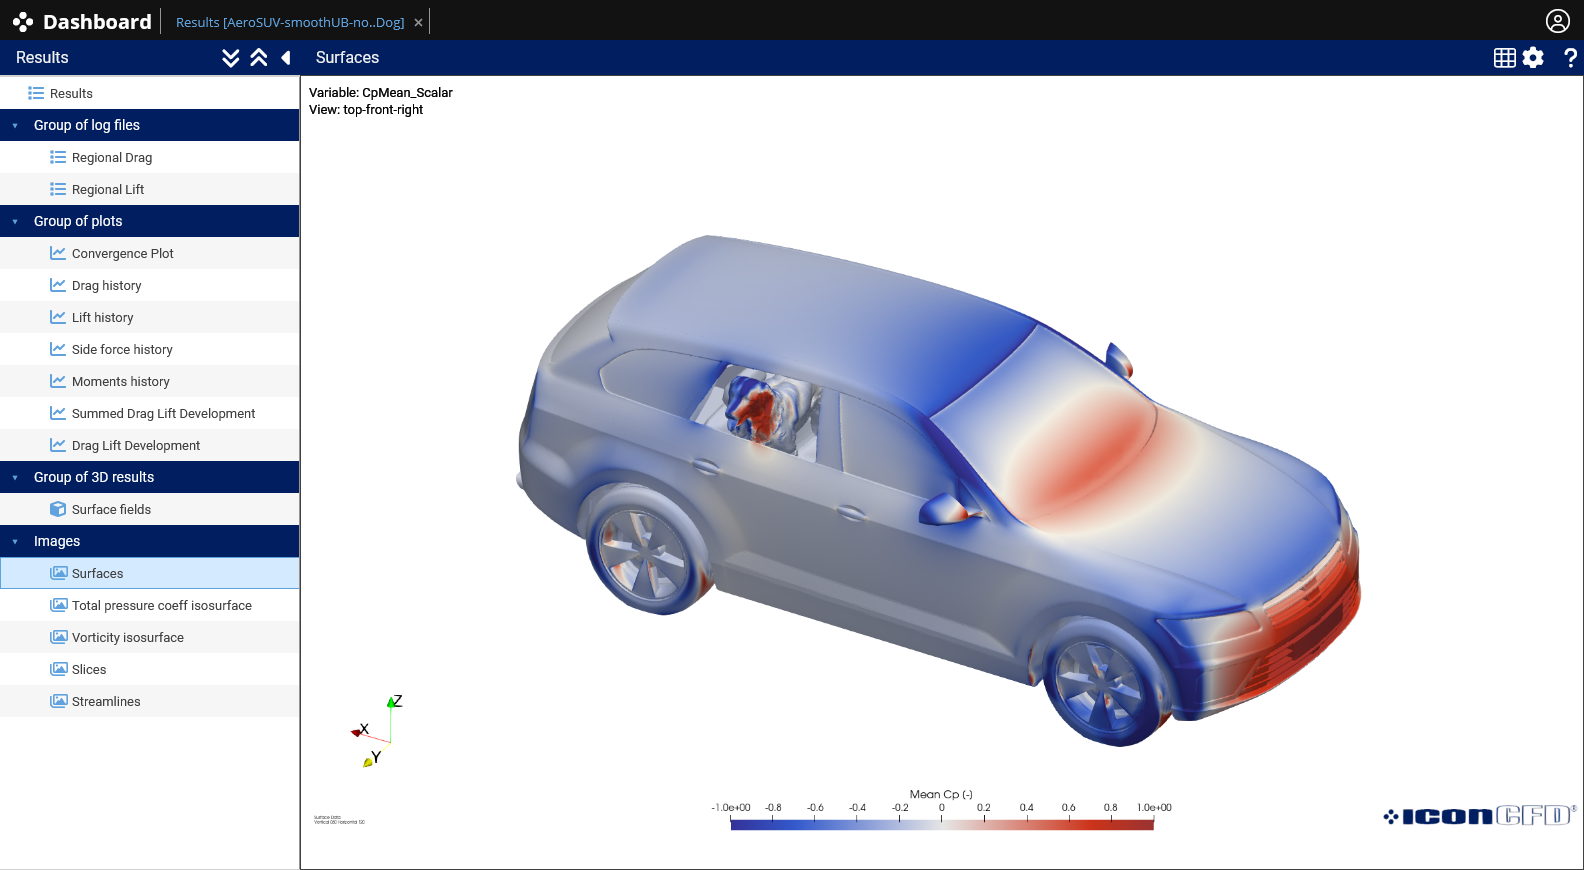
Surface pressure
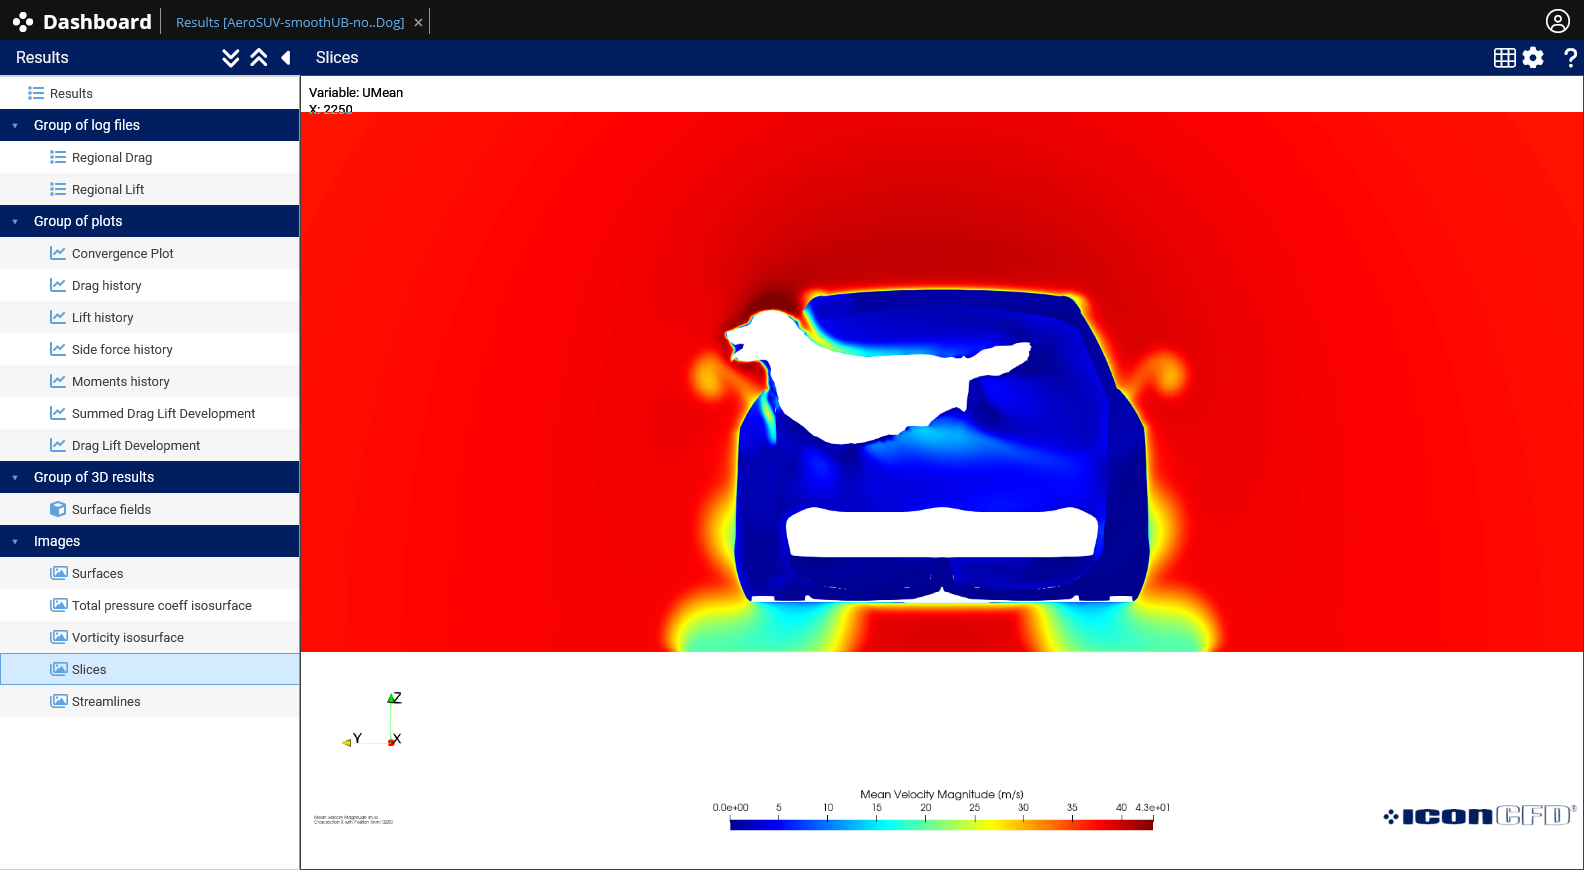
Velocity Magnitude – X Axis
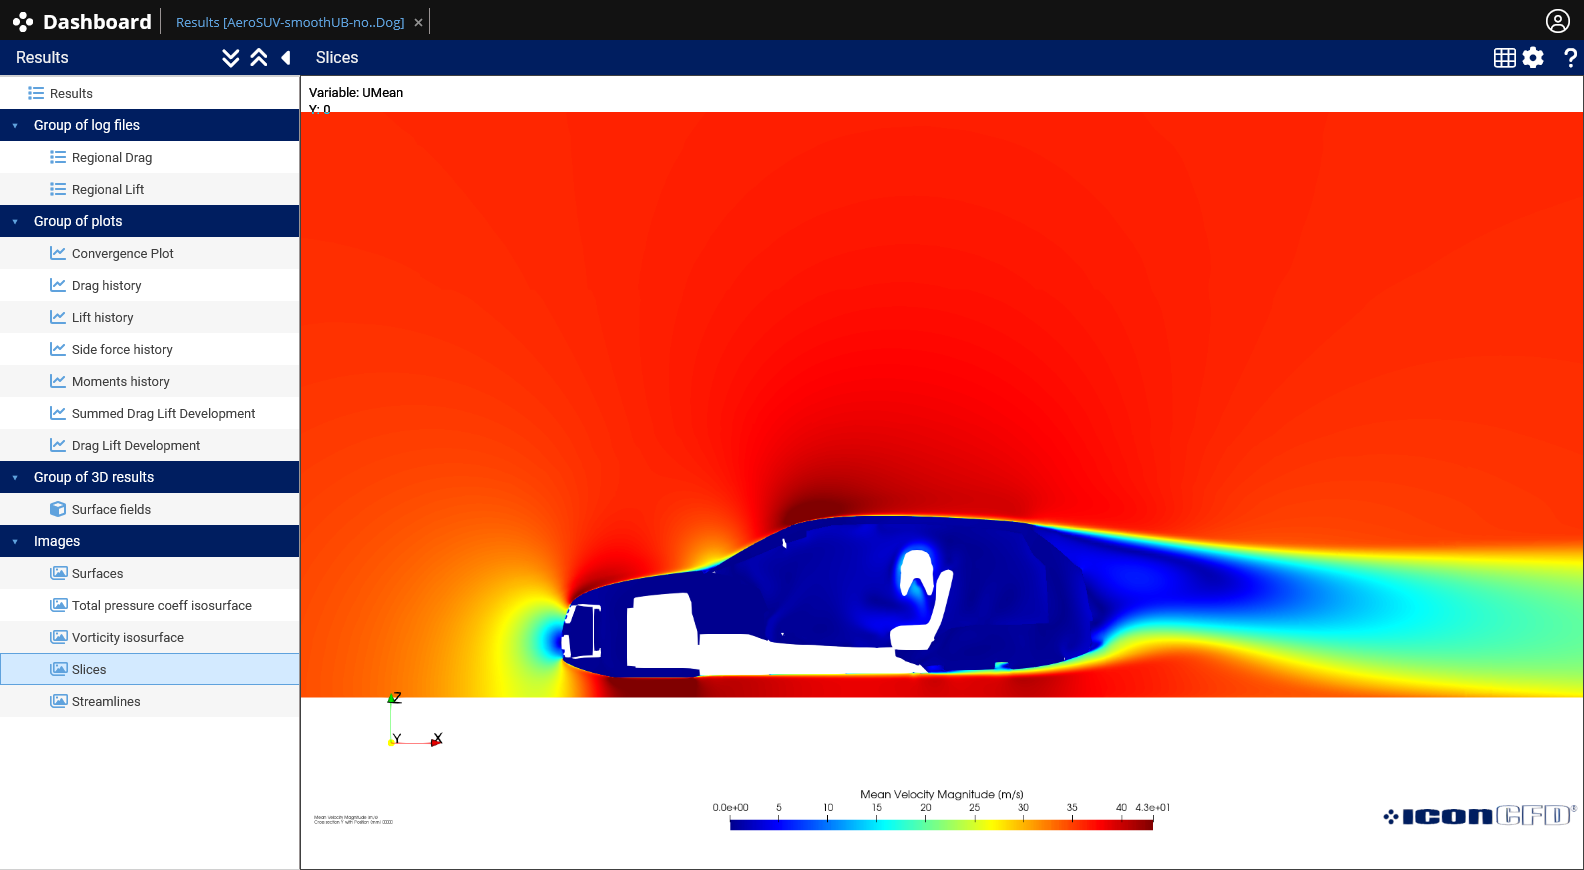
Velocity Magnitude – Y Axis (Y=0)
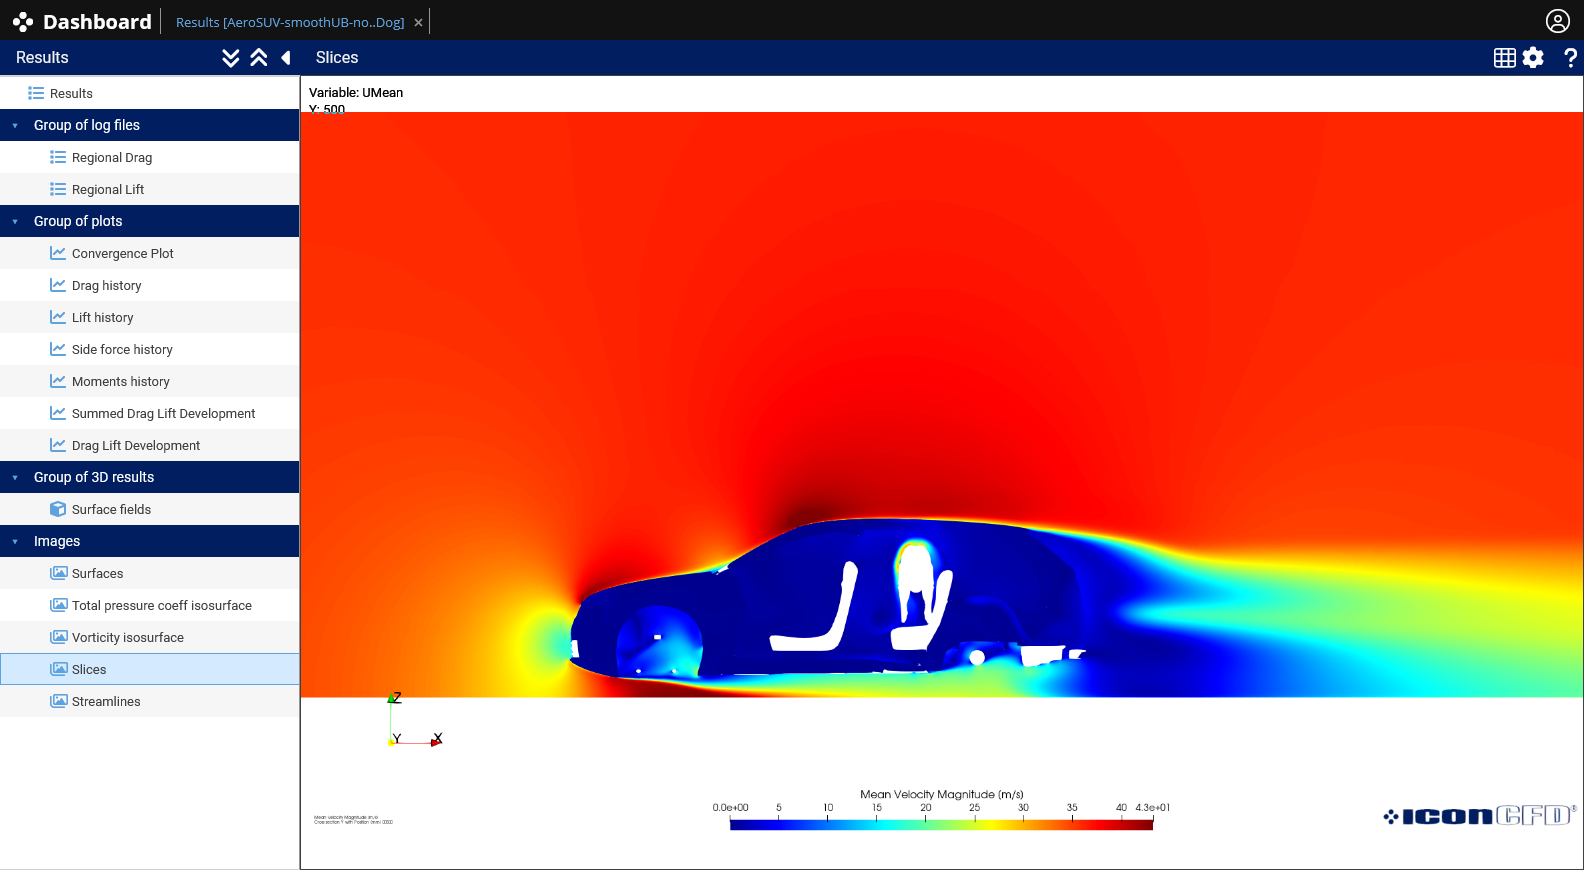
Velocity Magnitude – Y Axis (Y=500mm)
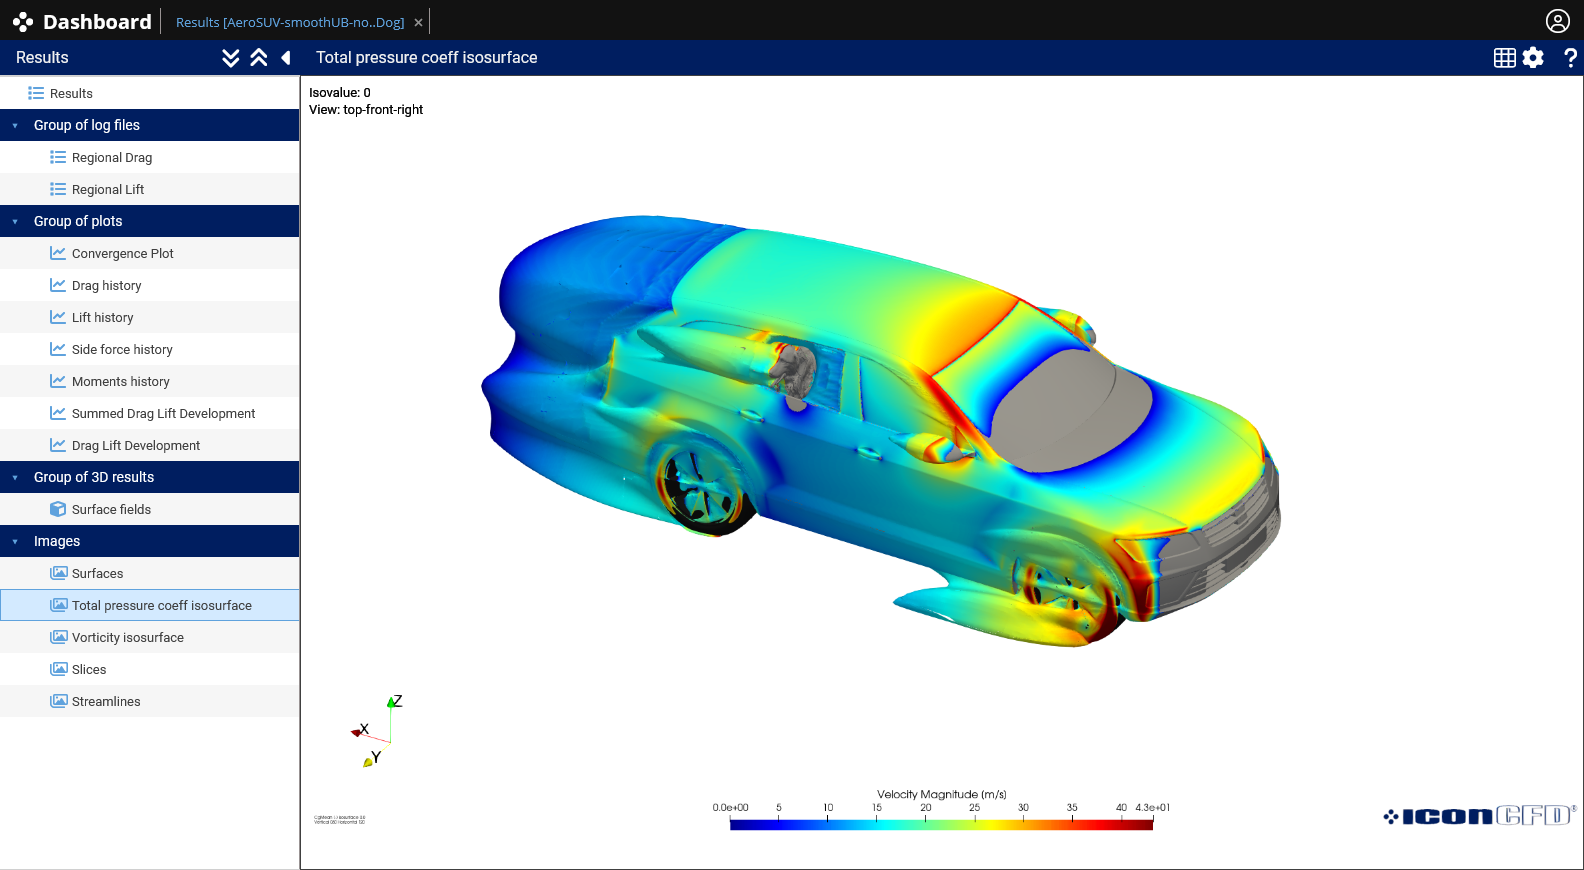
Total pressure isosurface coloured by velocity magnitude
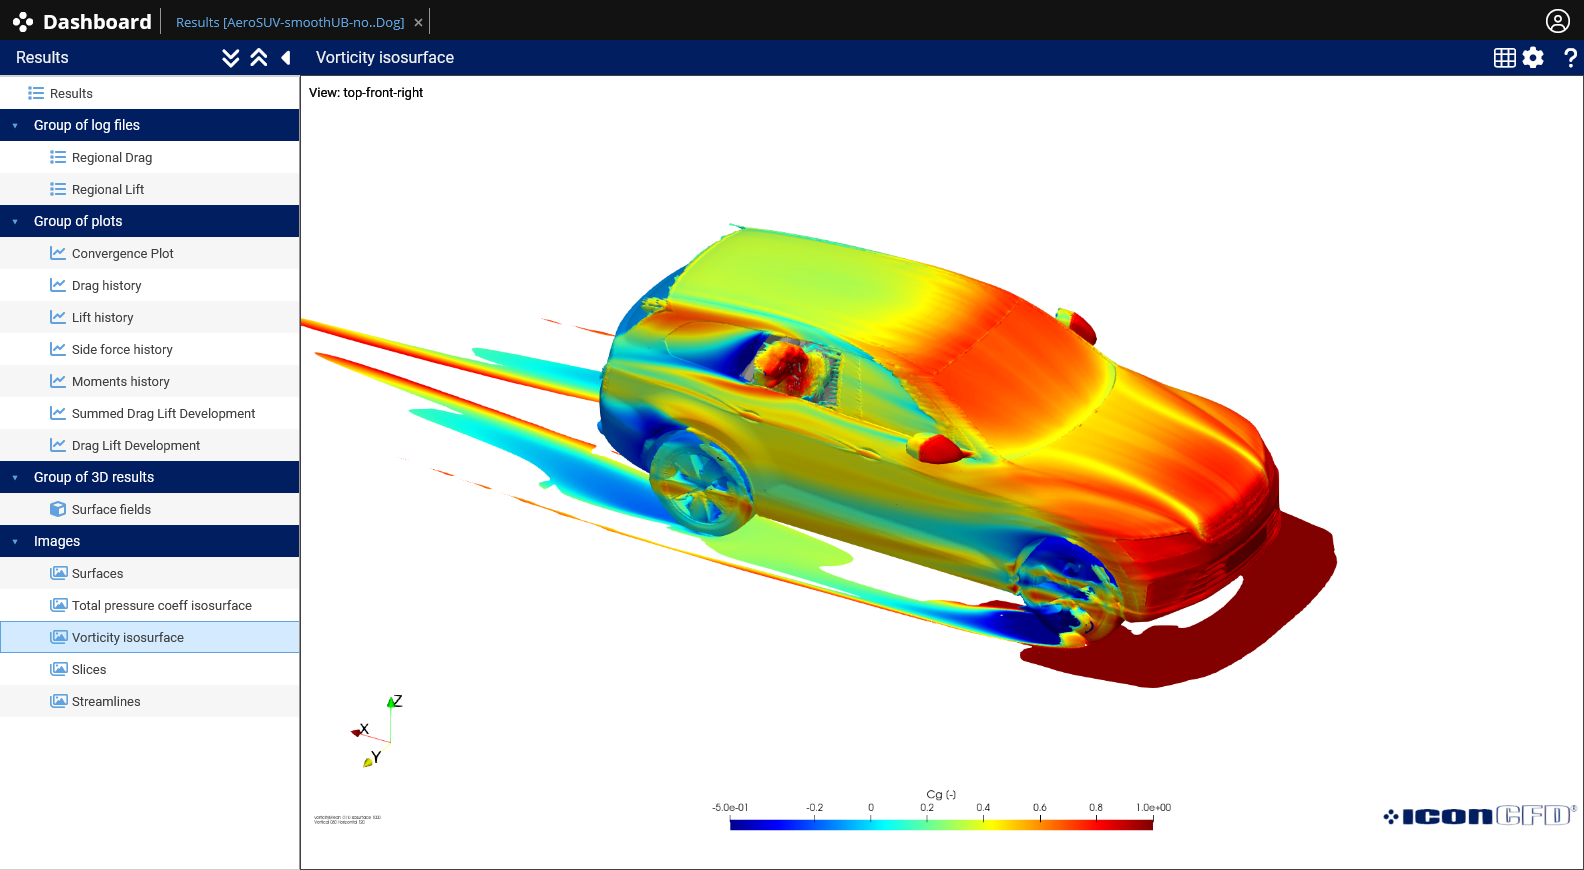
Vorticity isosurface coloured by total pressure
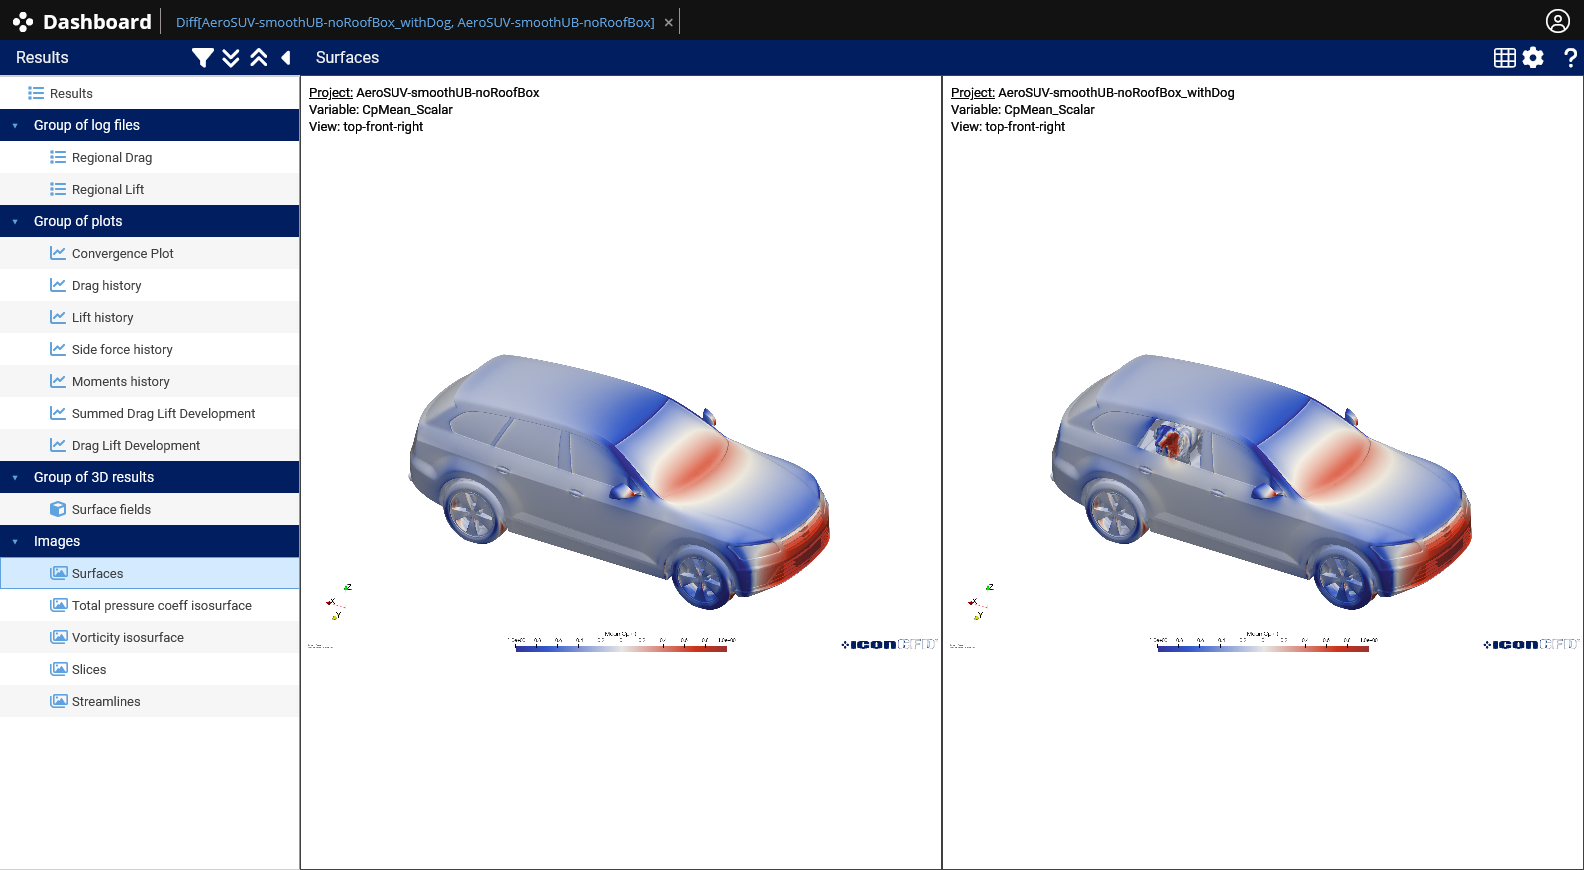
Surface pressure – Scenarios 1&4 Comparison
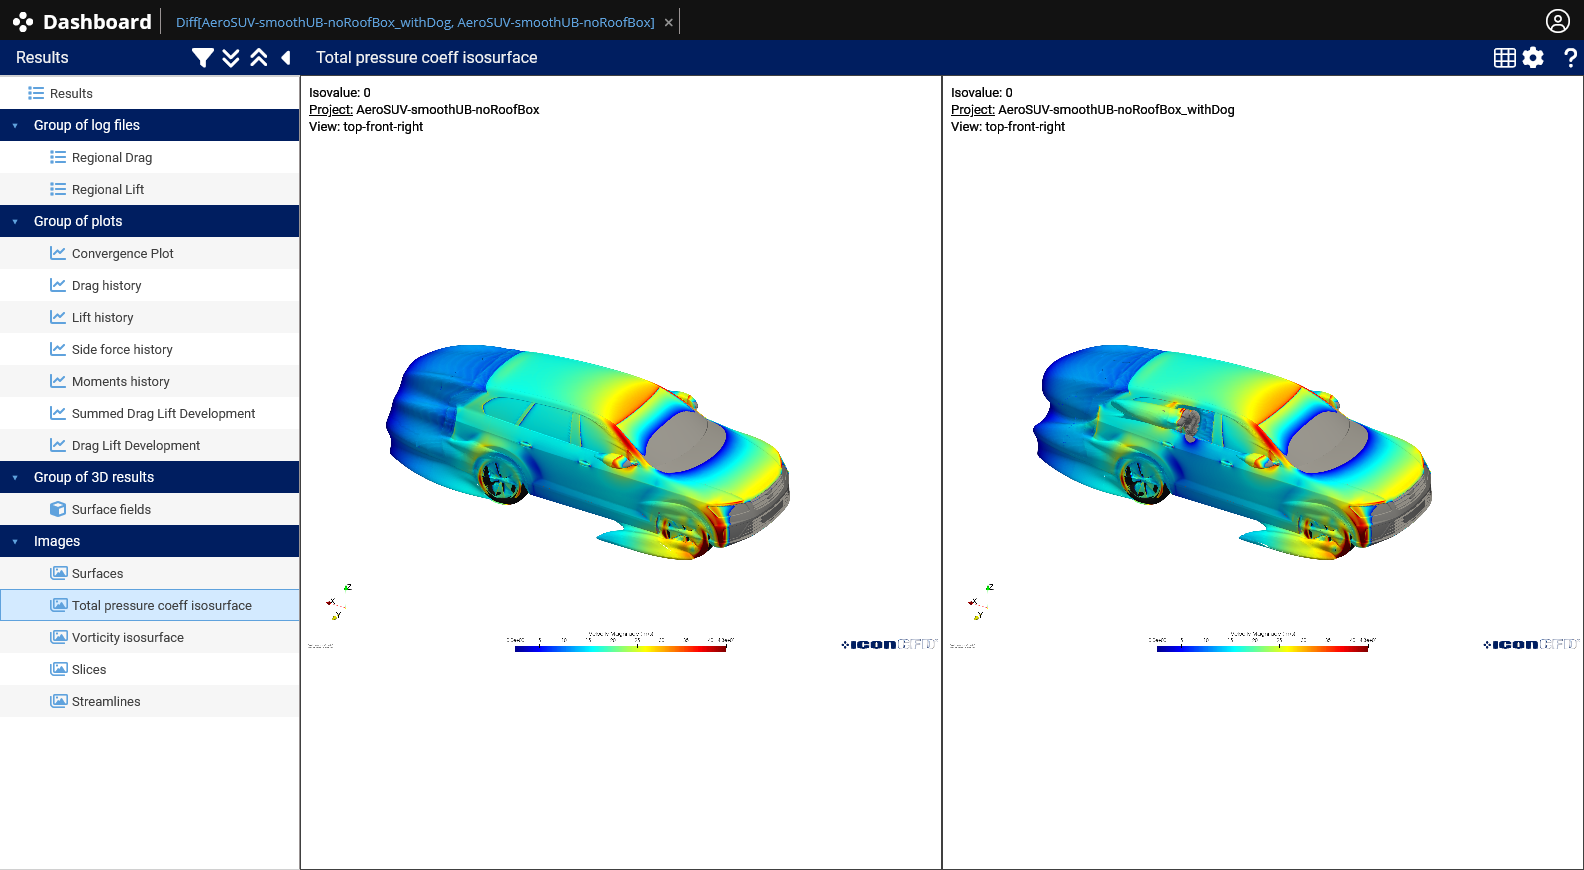
Total pressure isosurface coloured by velocity magnitude – Scenarios 1&4 Comparison
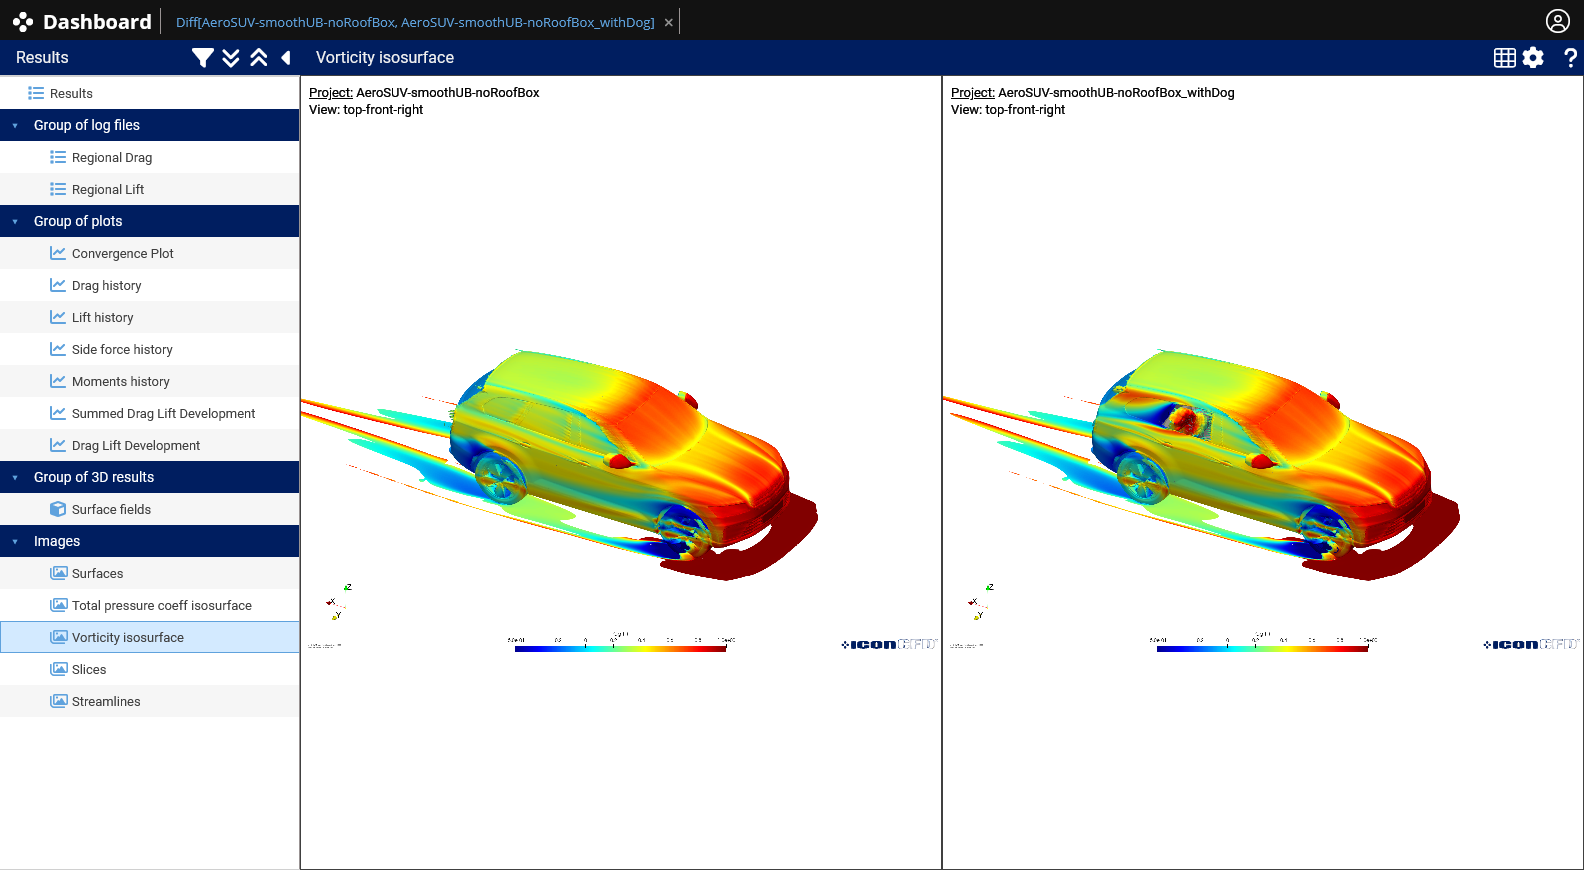
Vorticity isosurface coloured by total pressure – Scenarios 1&4 Comparison
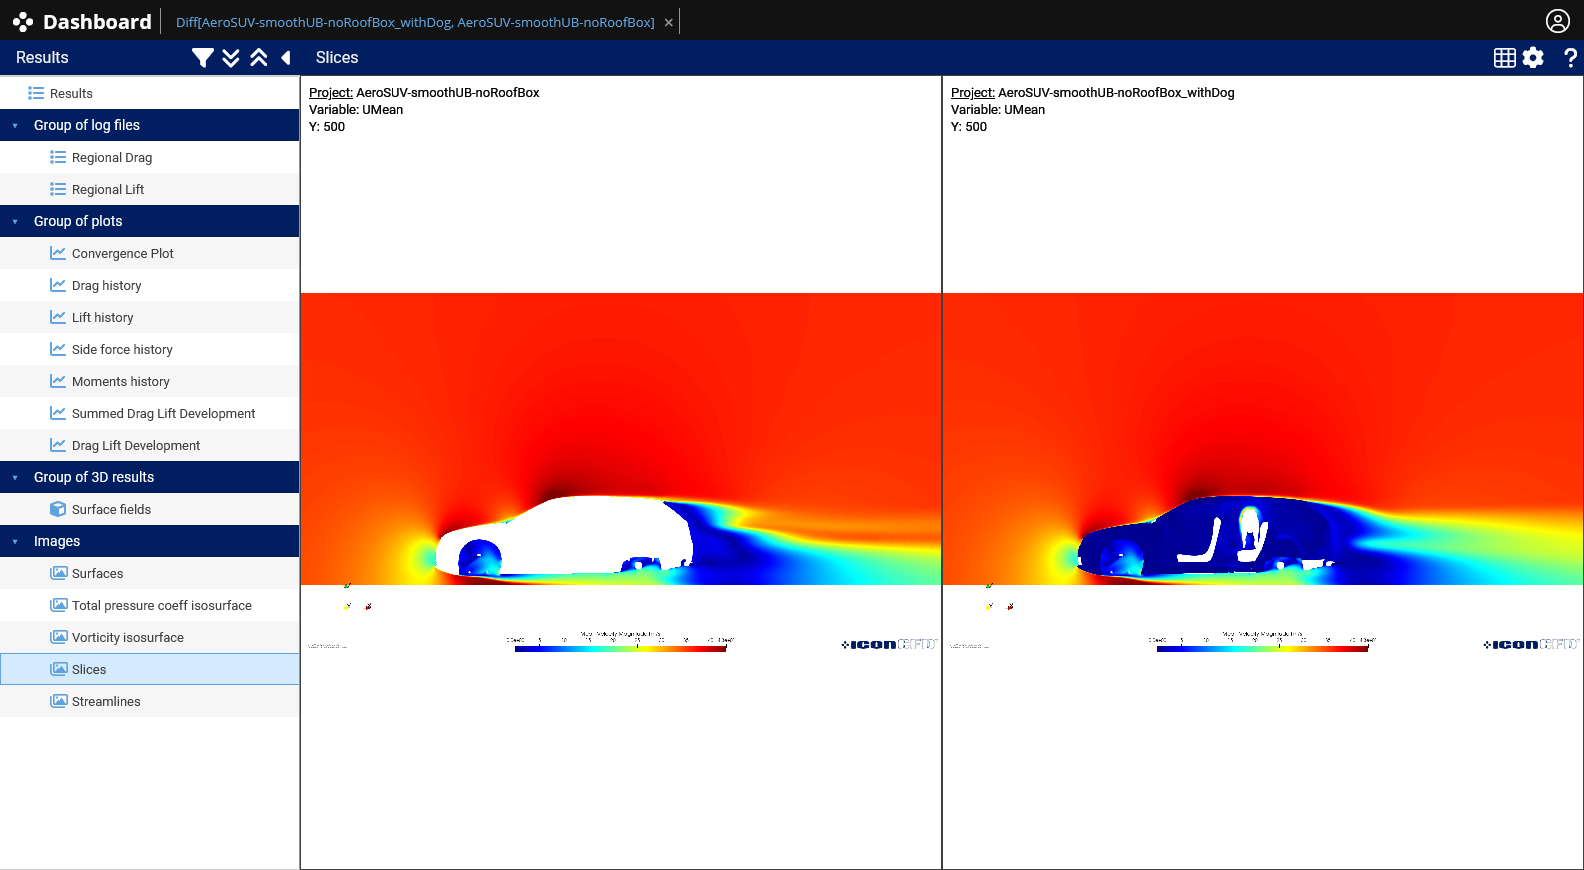
Velocity Magnitude – Y Axis (Y=0) – Scenarios 1&4 Comparison
Scenario 4 Drag coefficient:
| Car + pet in rear window | Cd = 0.313 | +12.19% vs baseline |
Scenario 5 – Car + rooftop box + pet in rear window
Combines the rooftop box’s disturbance with the rear window effect – two distinct sources of flow disruption on the same vehicle.
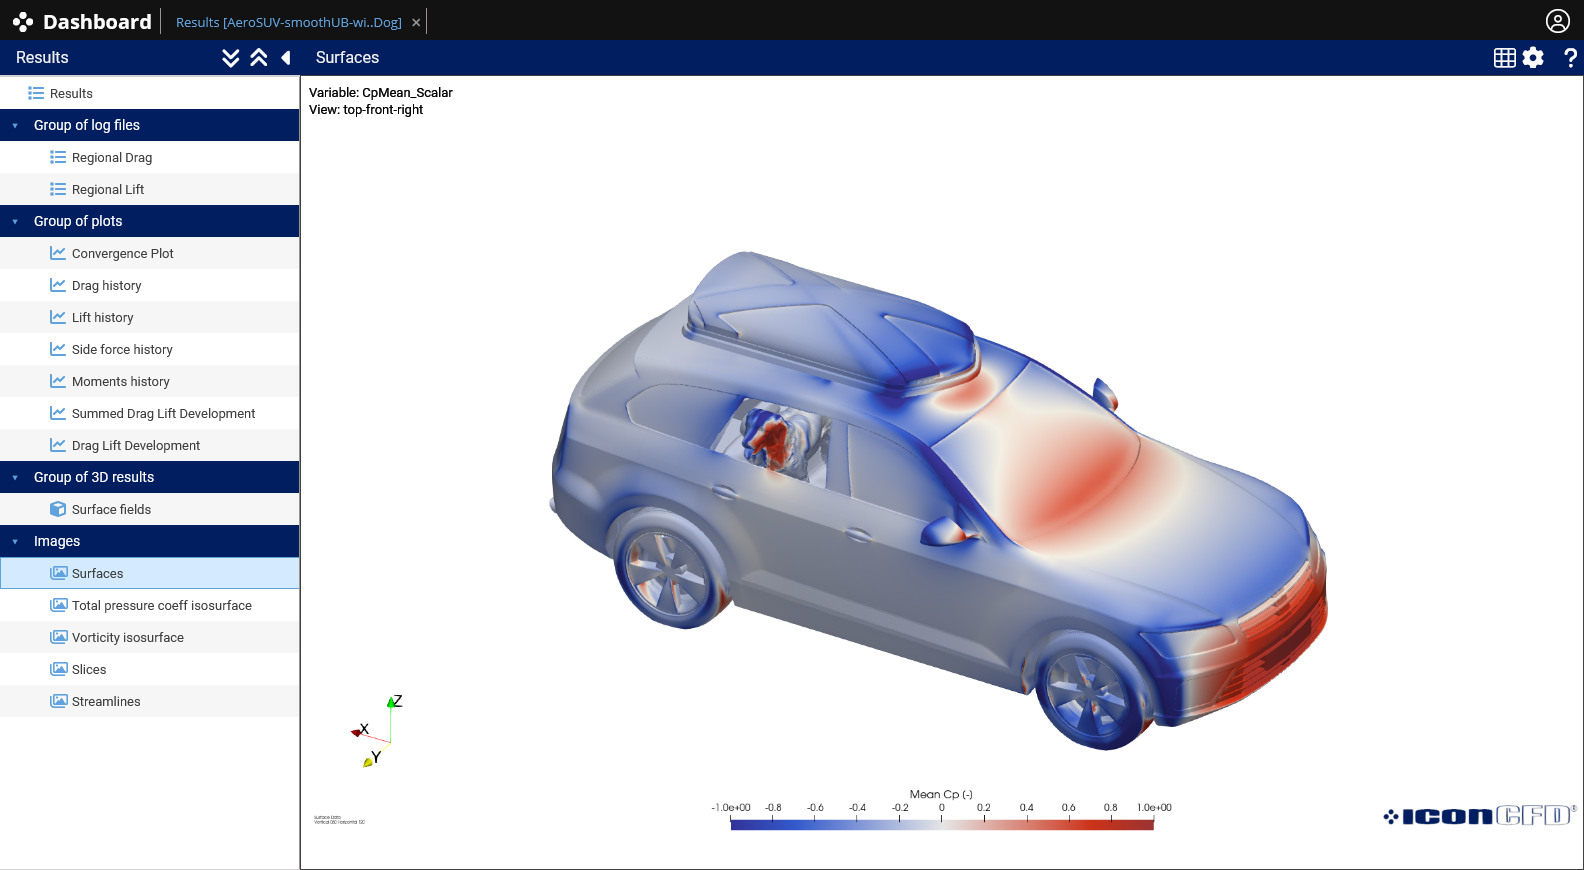
Surface pressure
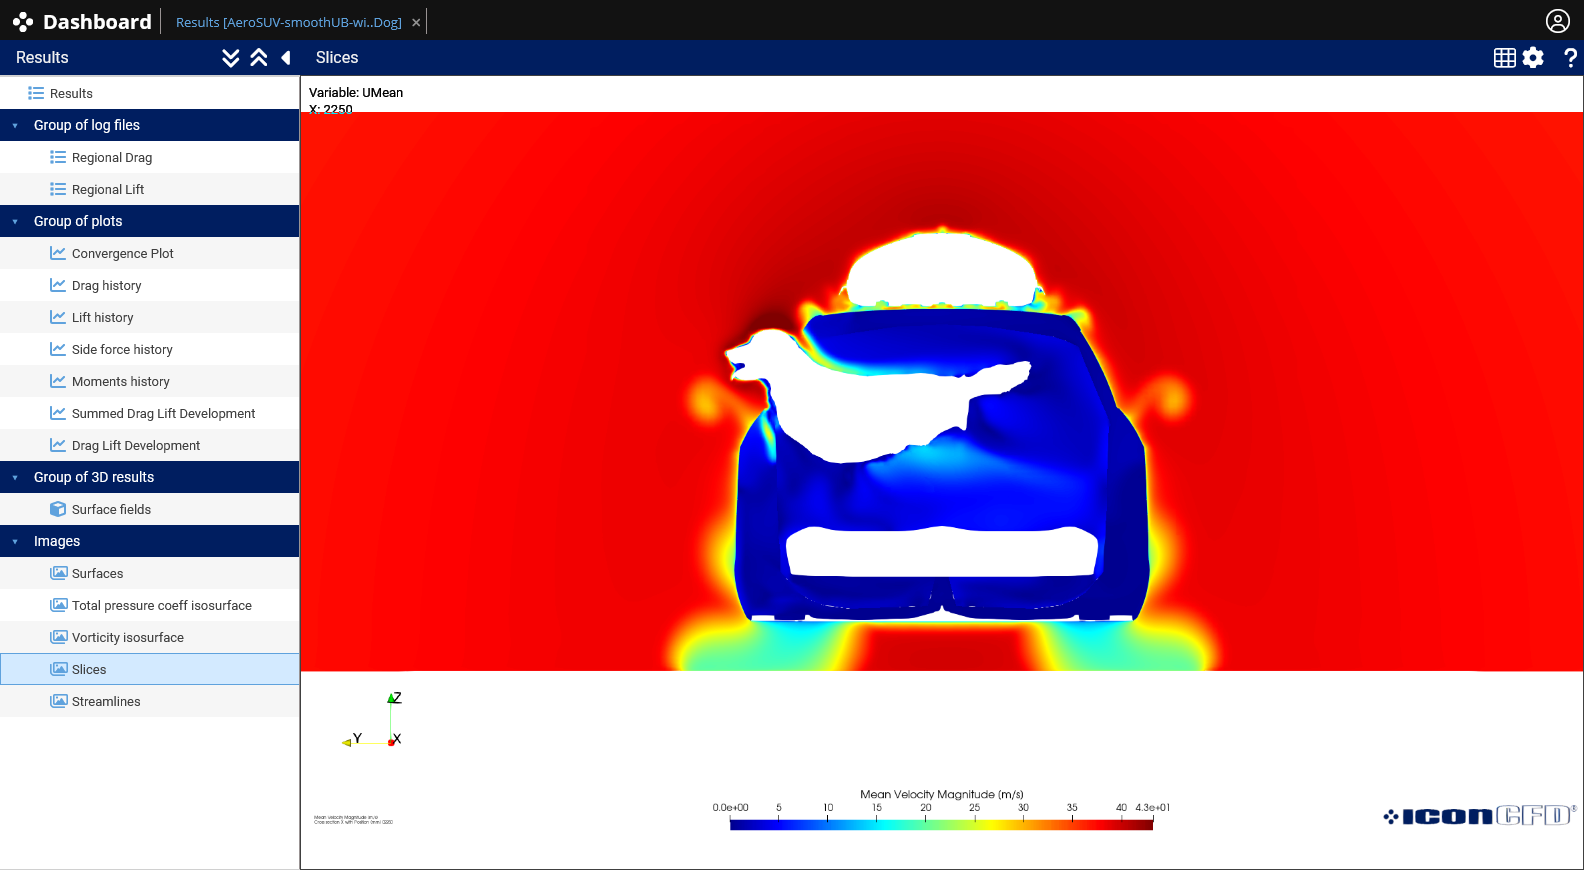
Velocity Magnitude – X Axis
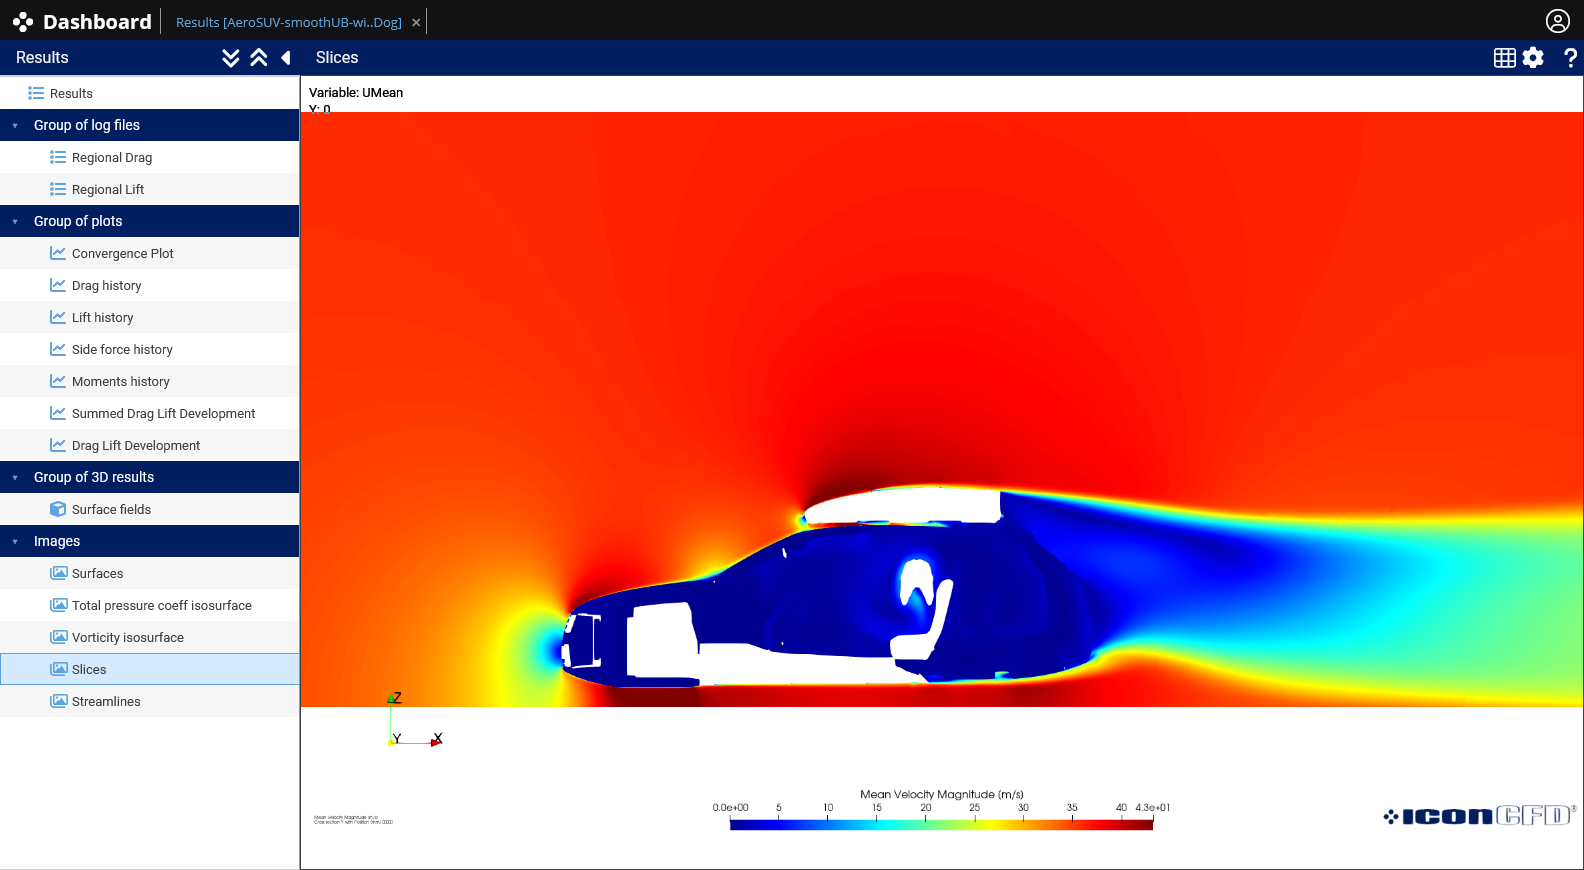
Velocity Magnitude – Y Axis (Y=0)
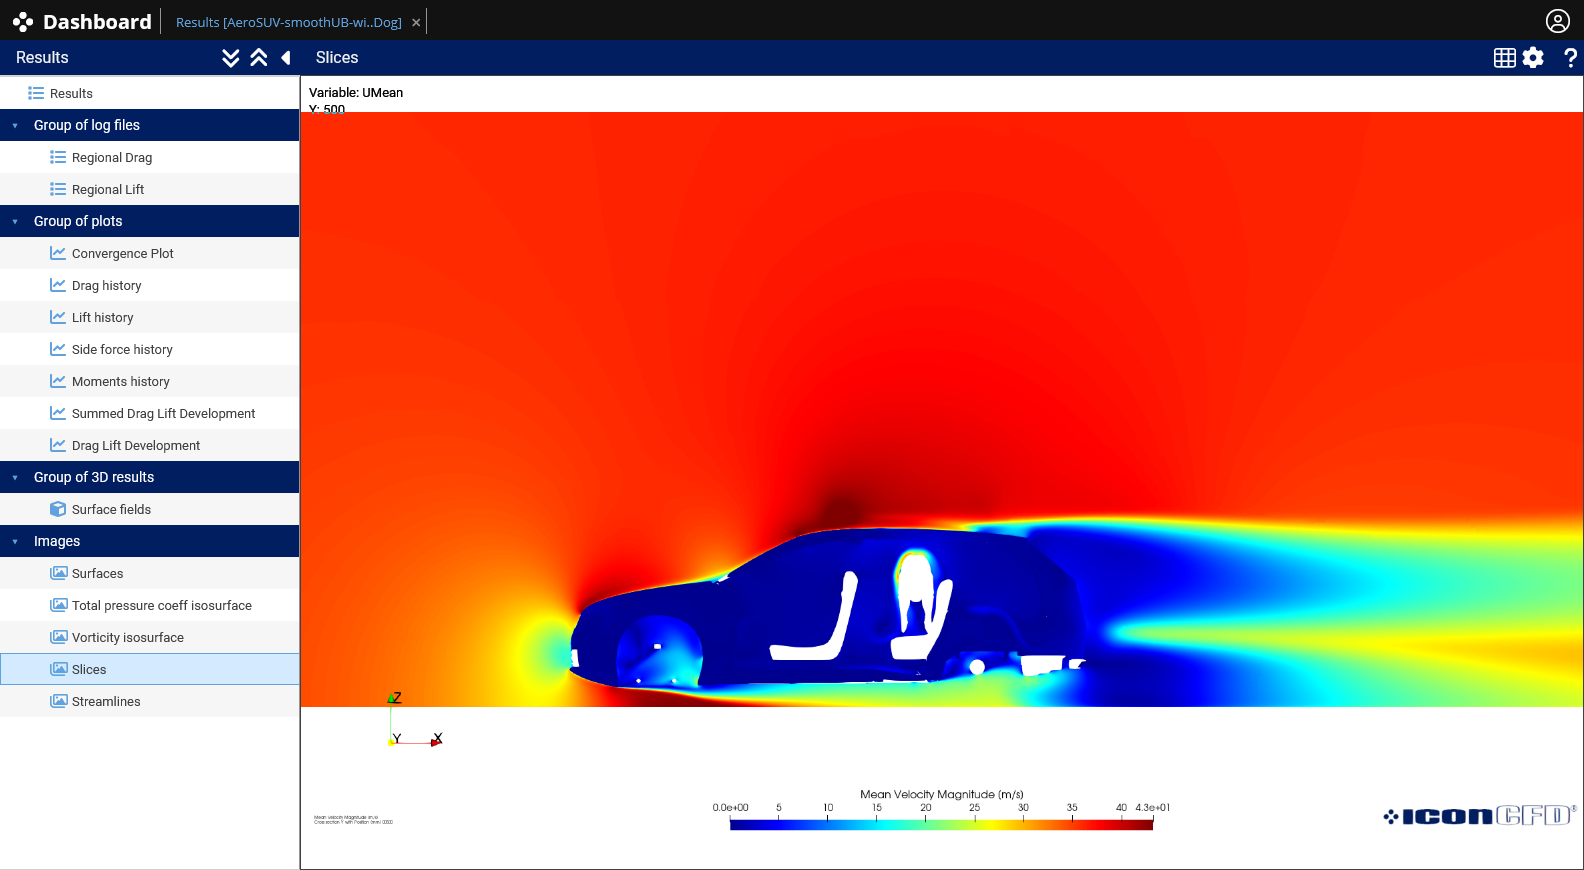
Velocity Magnitude – Y Axis (Y=500mm)
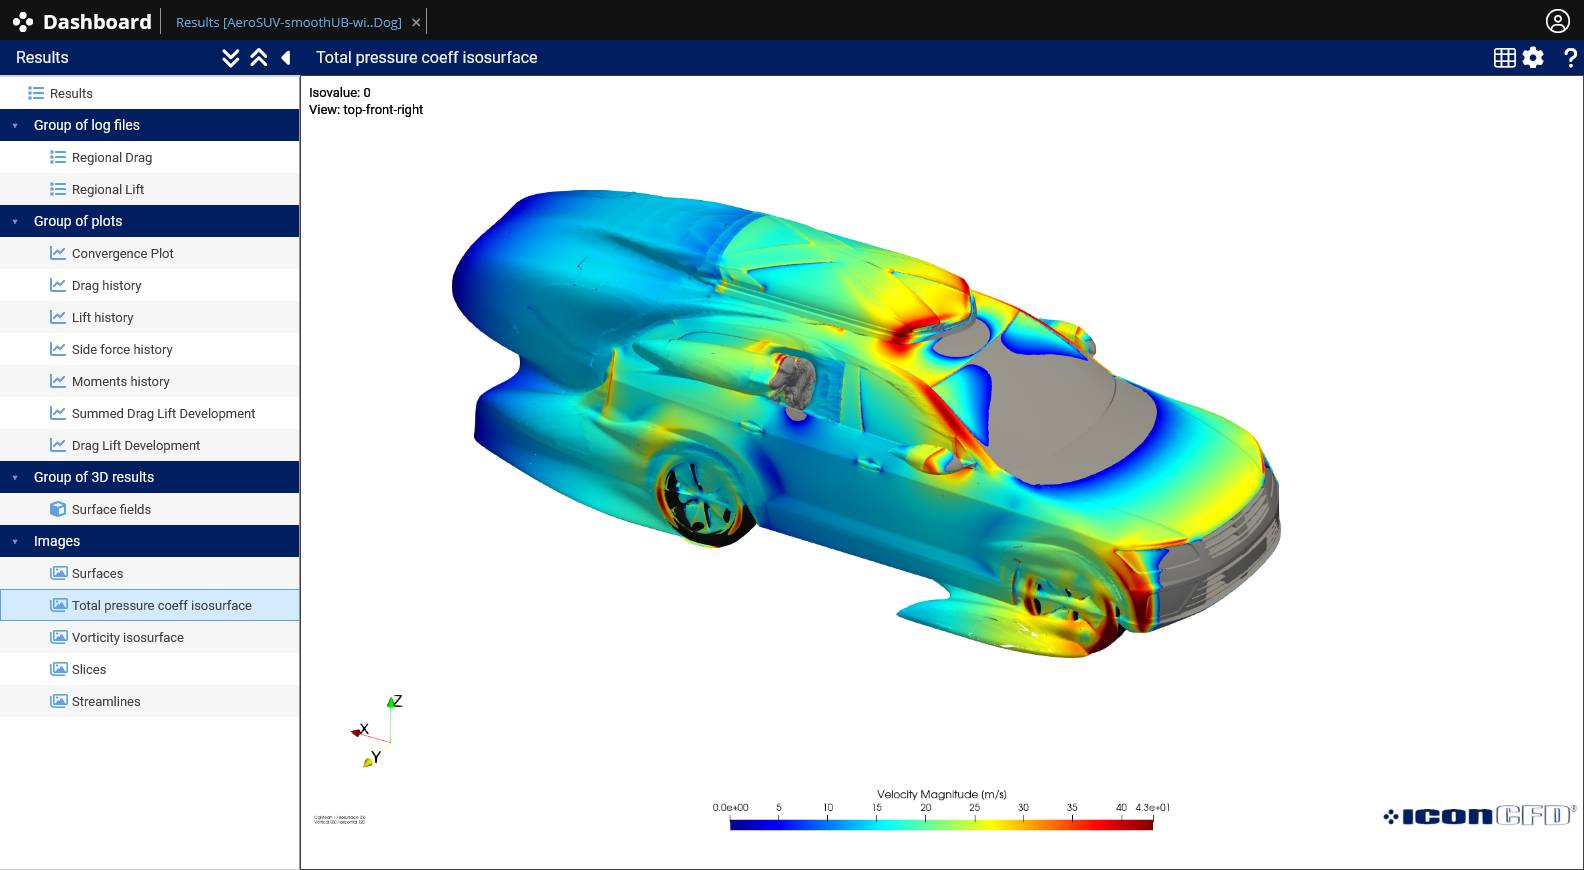
Total pressure isosurface coloured by velocity magnitude
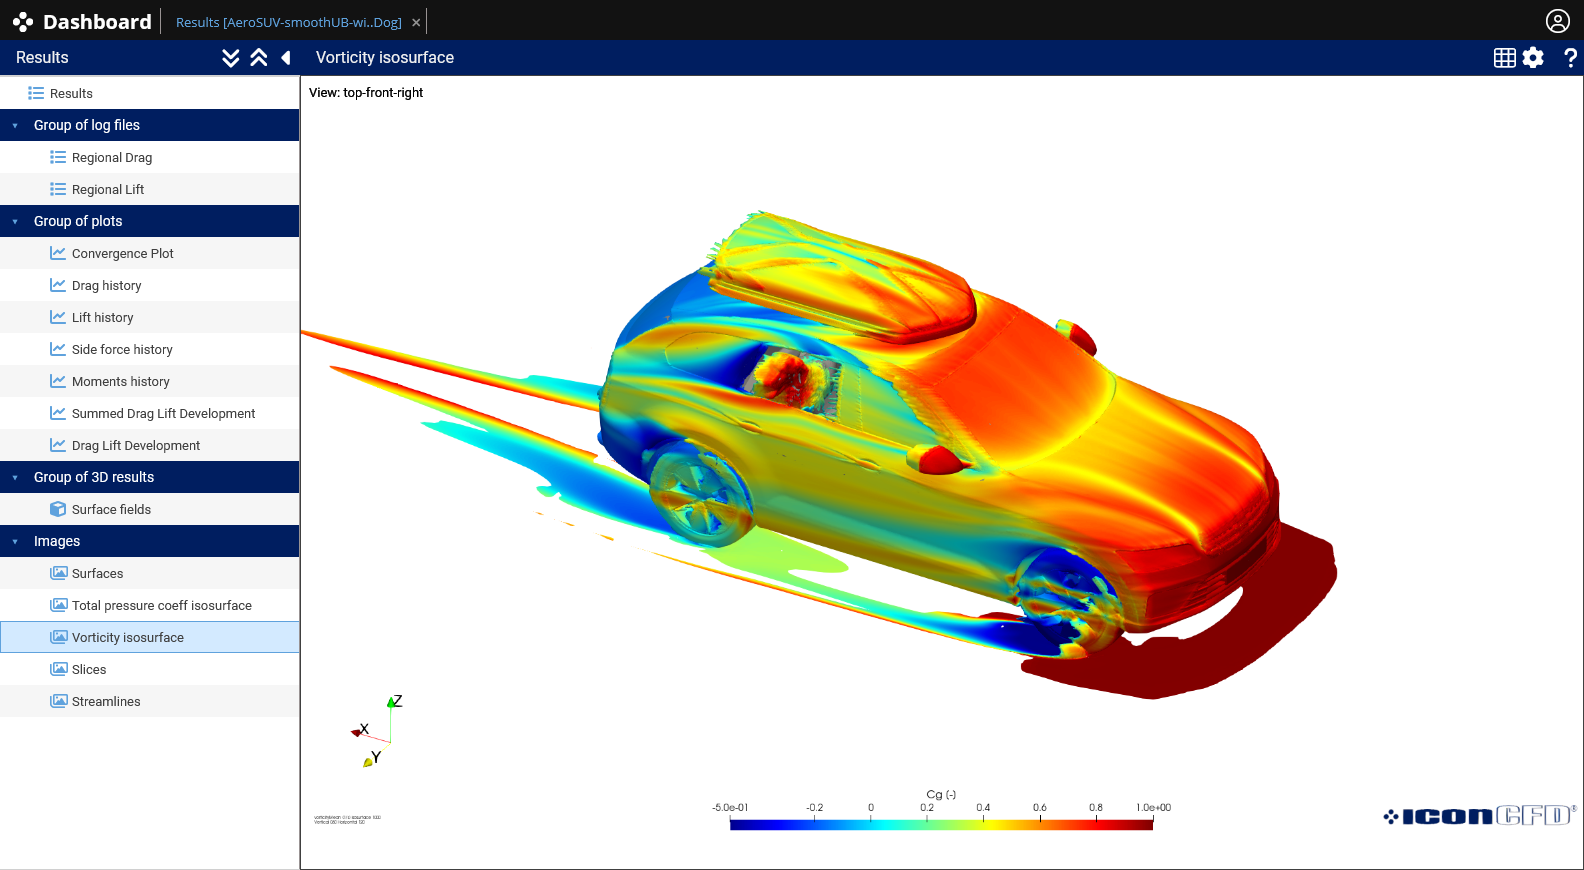
Vorticity isosurface coloured by total pressure
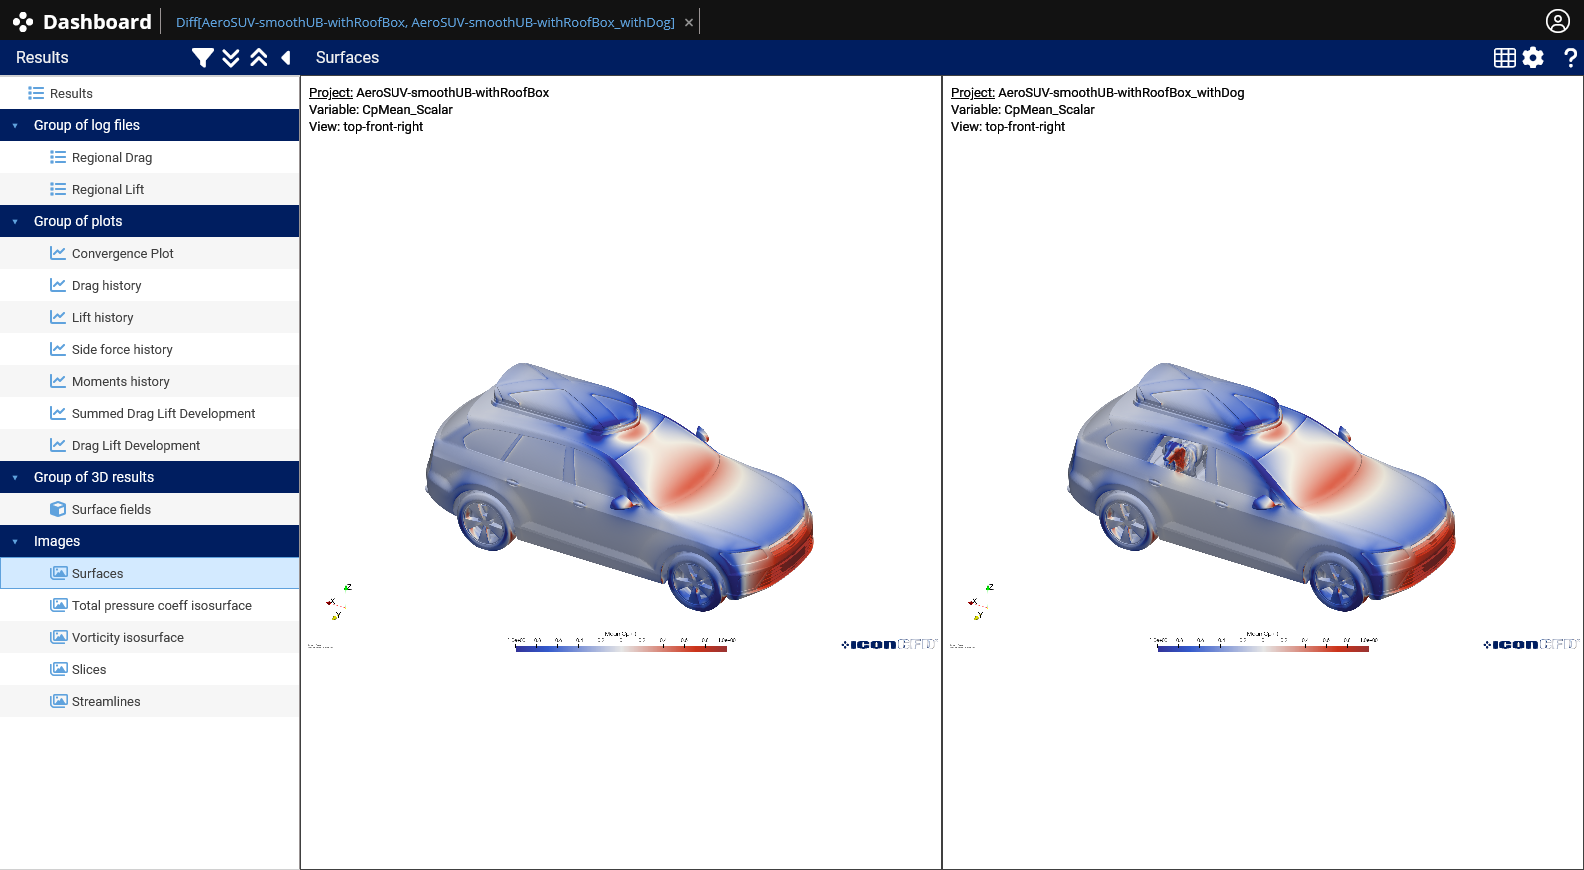
Surface pressure – Scenarios 2&5 Comparison
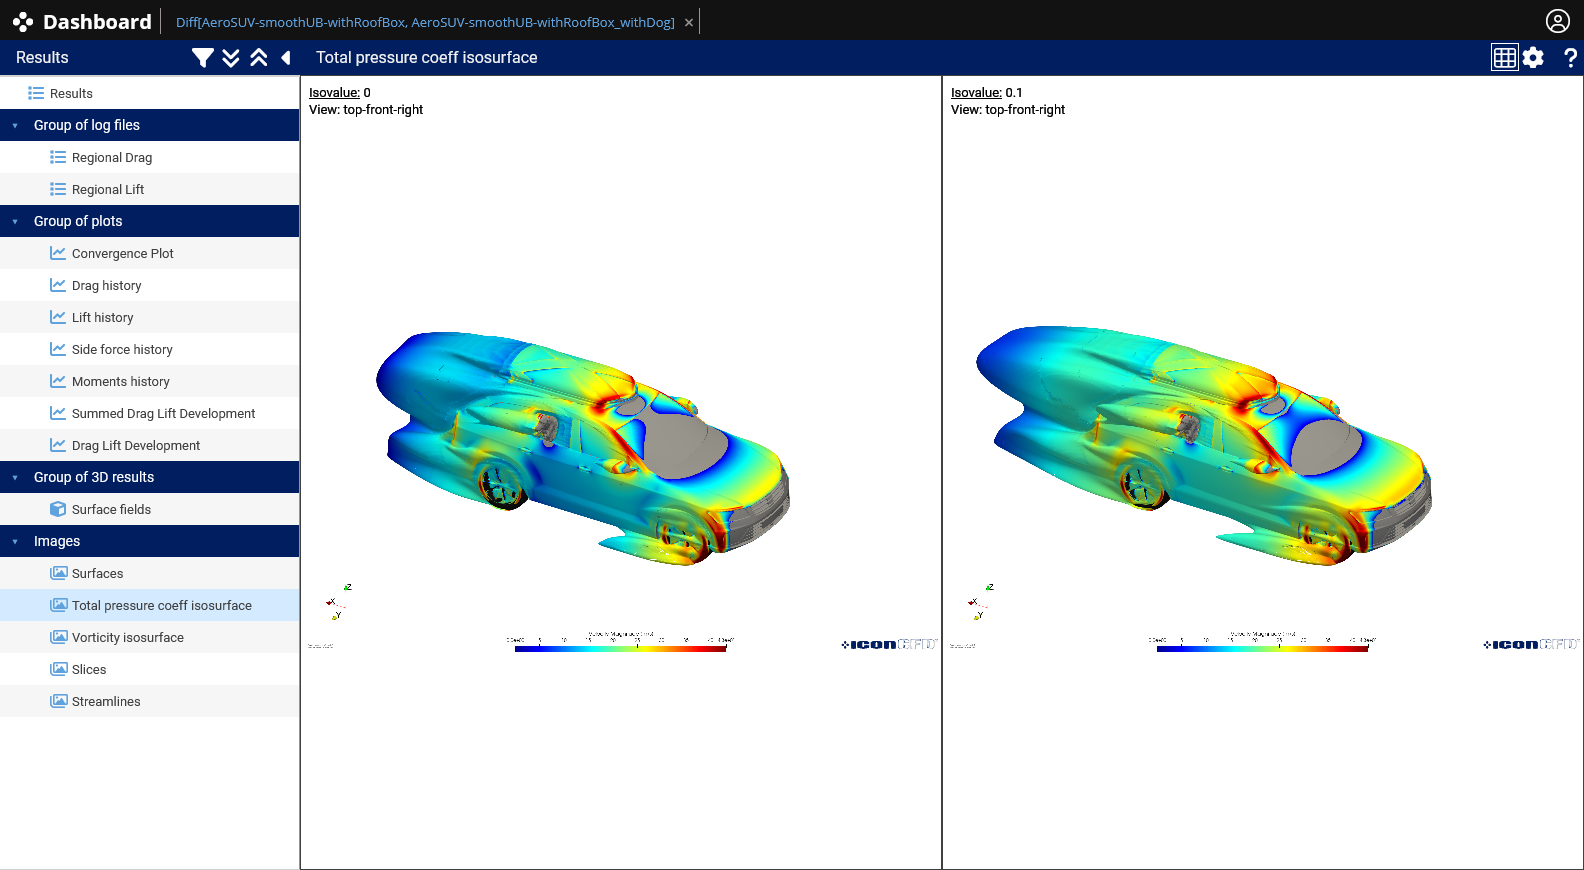
Total pressure isosurface coloured by velocity magnitude – Scenarios 2&5 Comparison
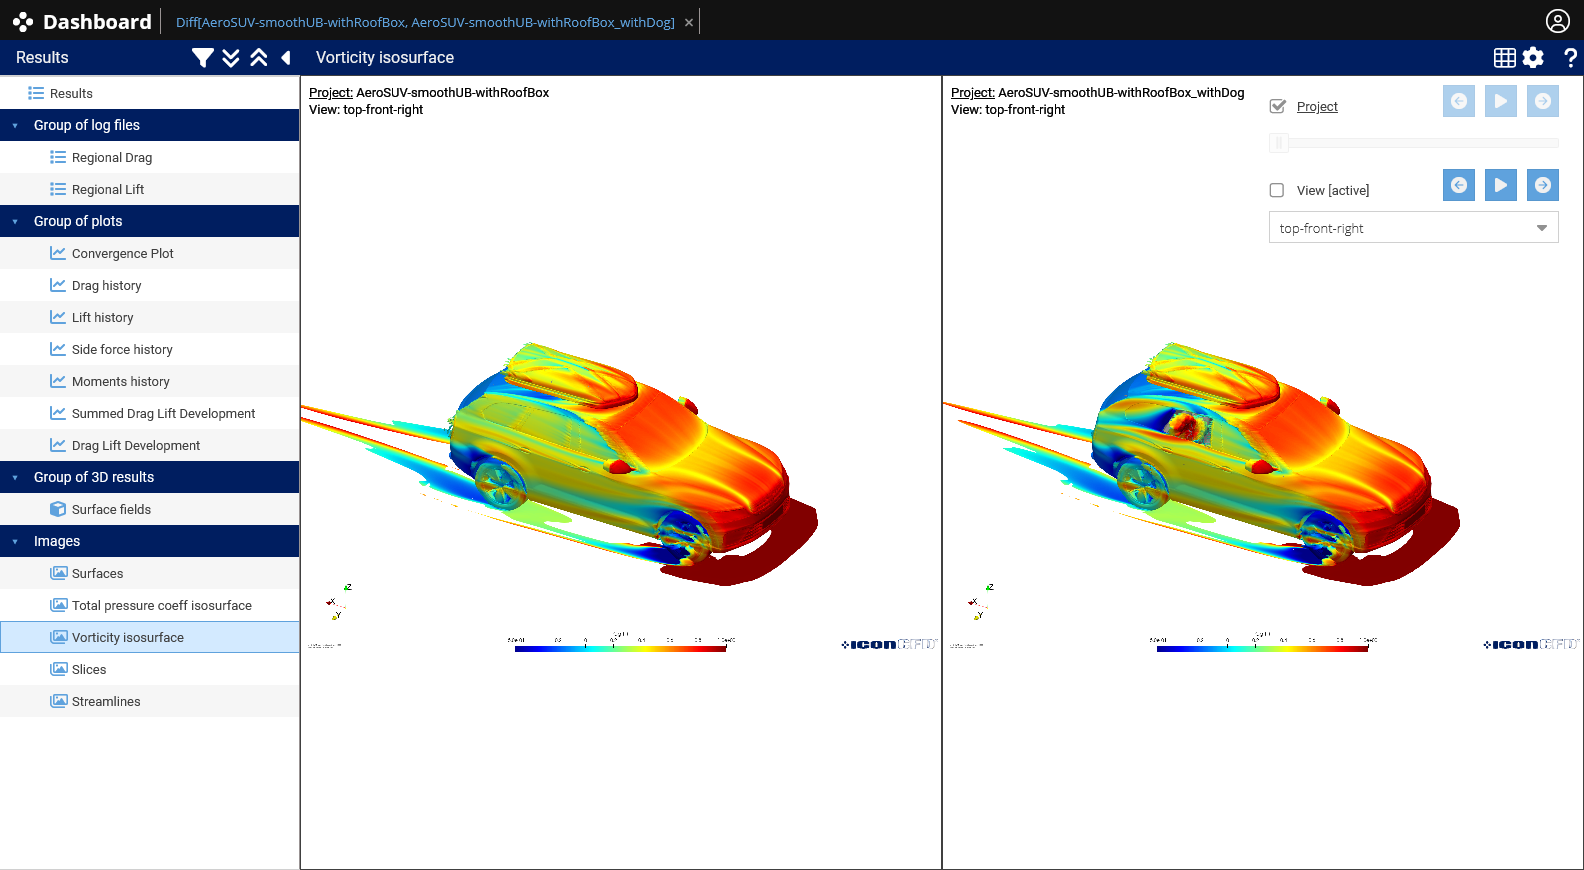
Vorticity isosurface coloured by total pressure – Scenarios 2&5 Comparison
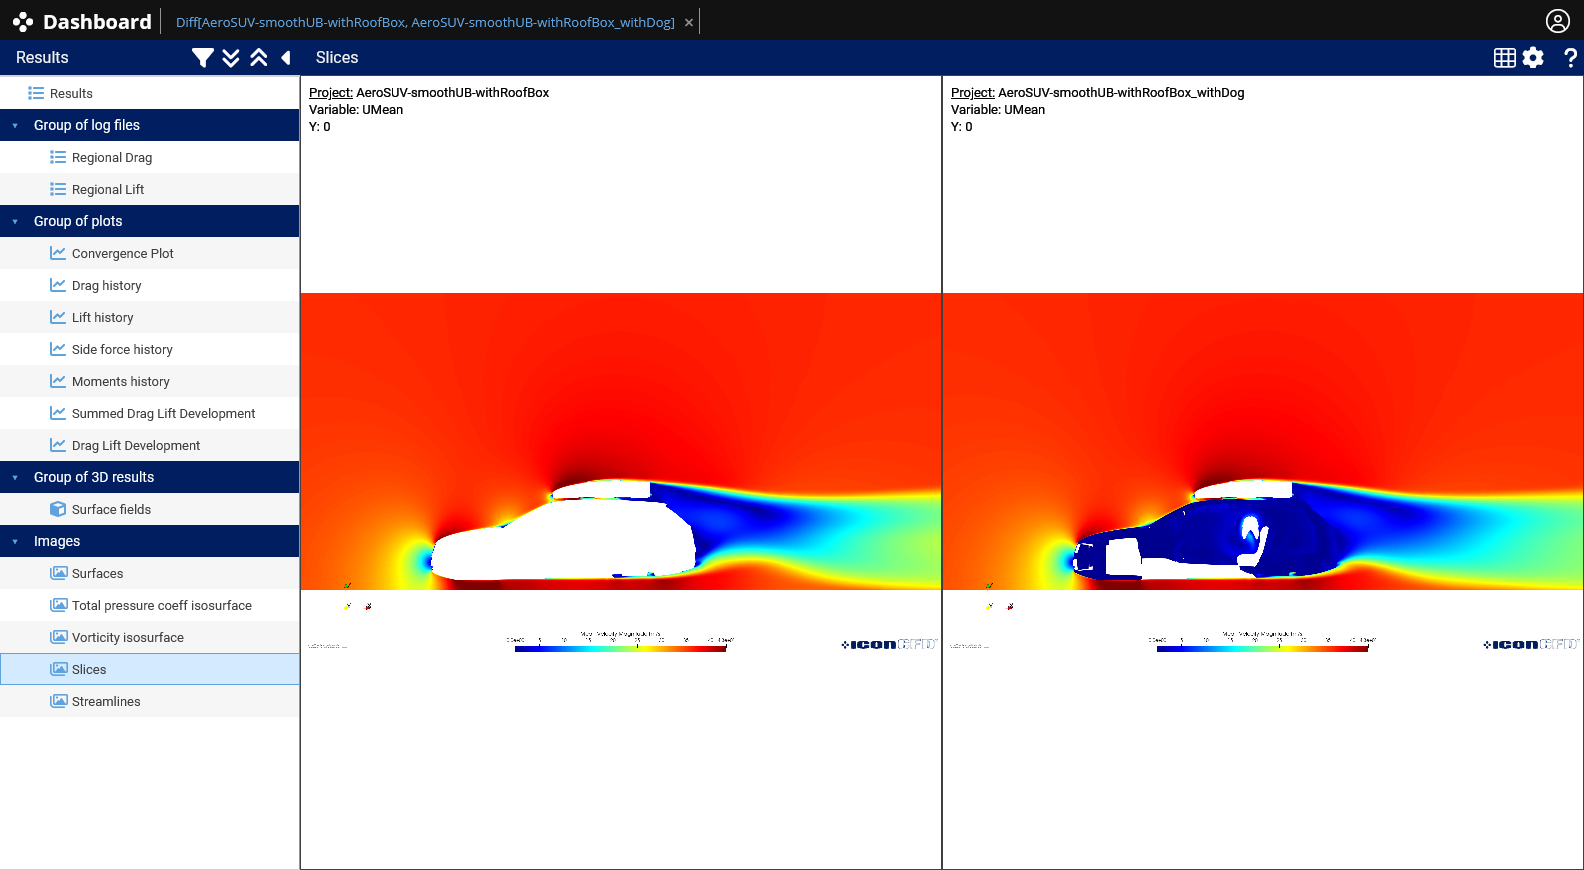
Velocity Magnitude – Y Axis (Y=0) – Scenarios 2&5 Comparison
Scenario 5 Drag coefficient:
| Car + rooftop box + pet | Cd = 0.389 | +39.43% vs baseline |
Scenario 6 – Car + rooftop box + caravan + pet in rear window
The complete holiday load-out – every element from the series combined into a single simulation.
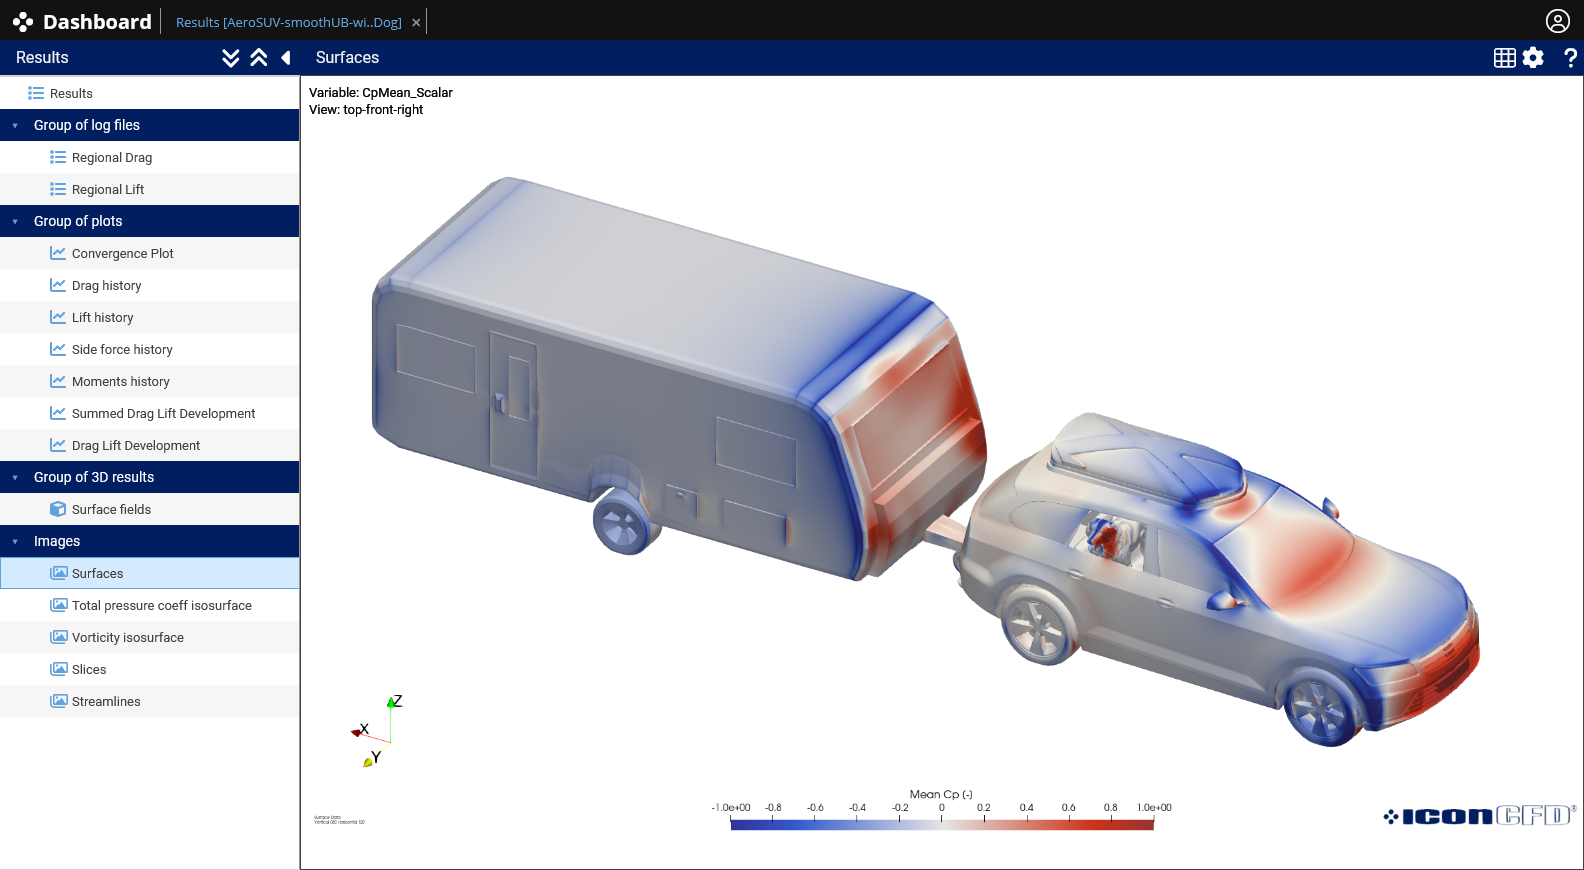
Surface pressure
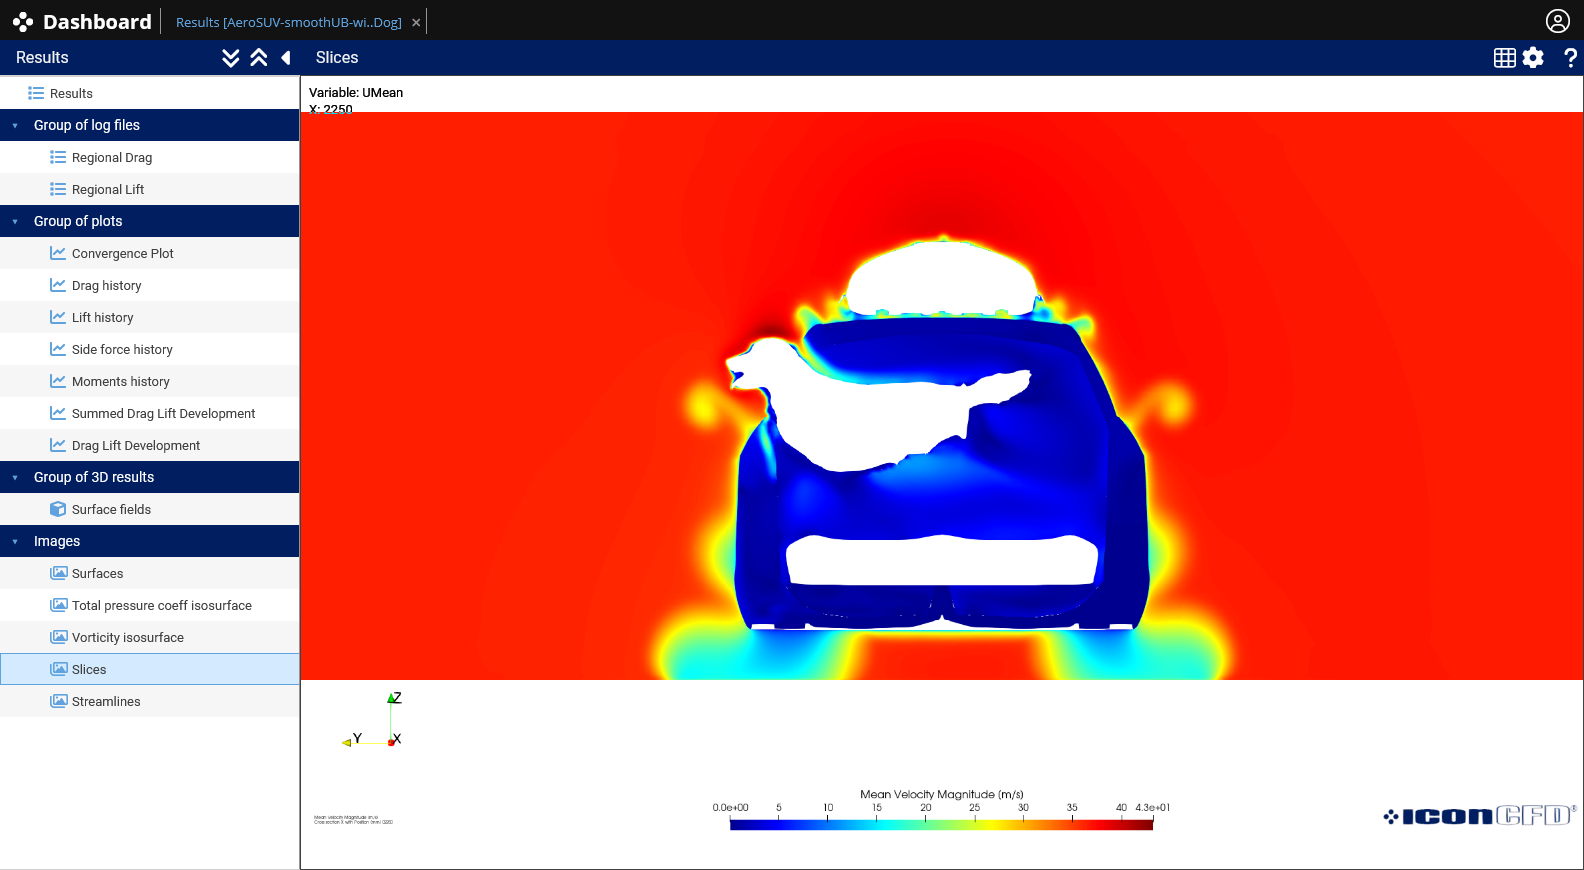
Velocity Magnitude – X Axis
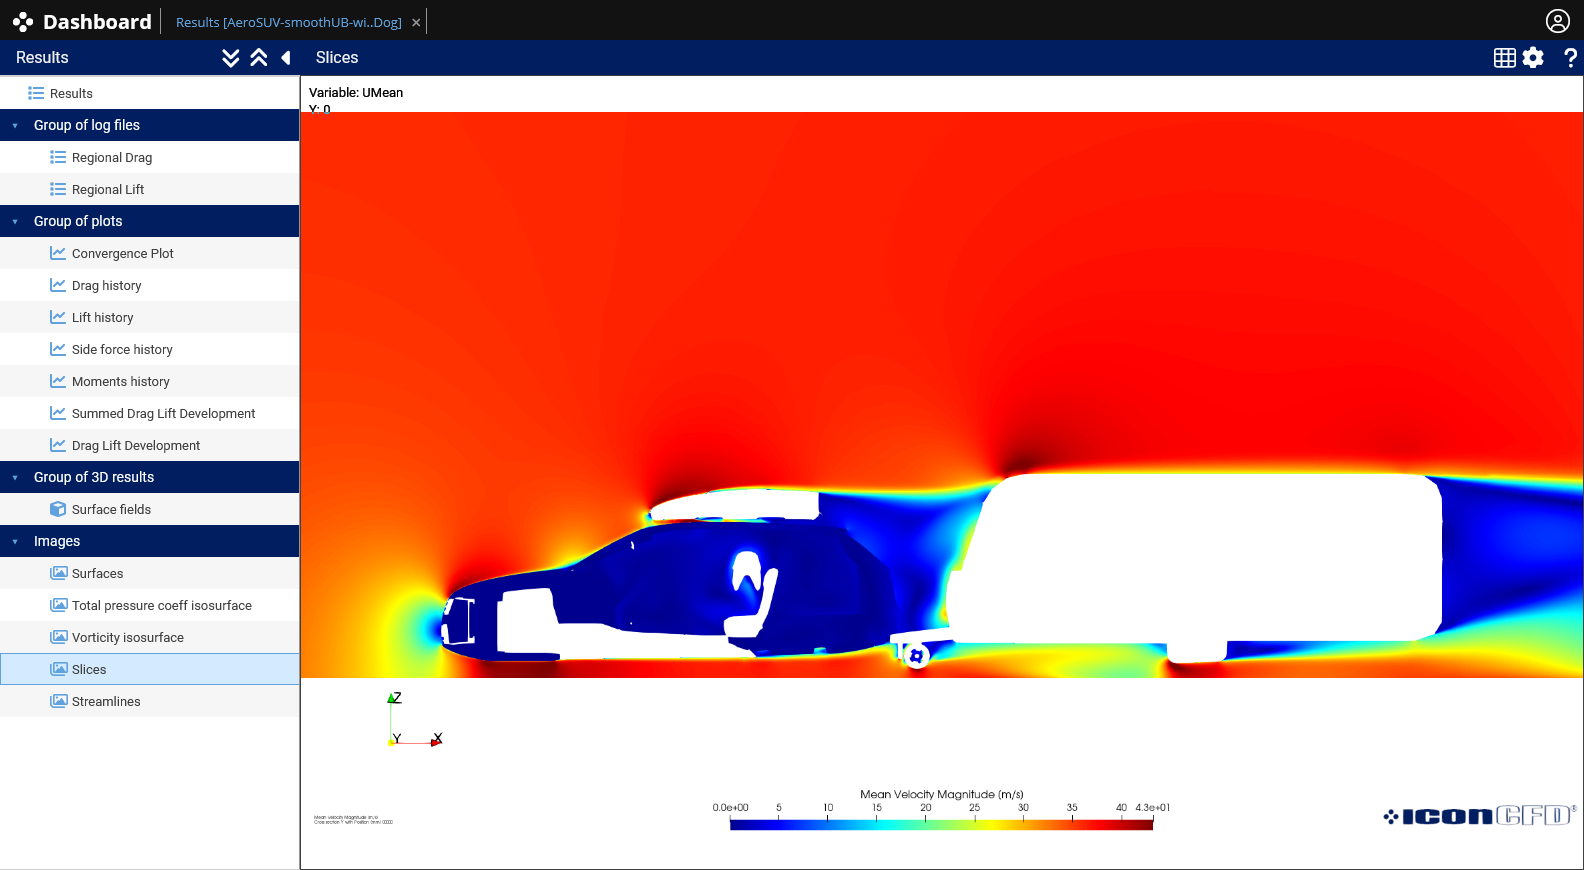
Velocity Magnitude – Y Axis (Y=0)
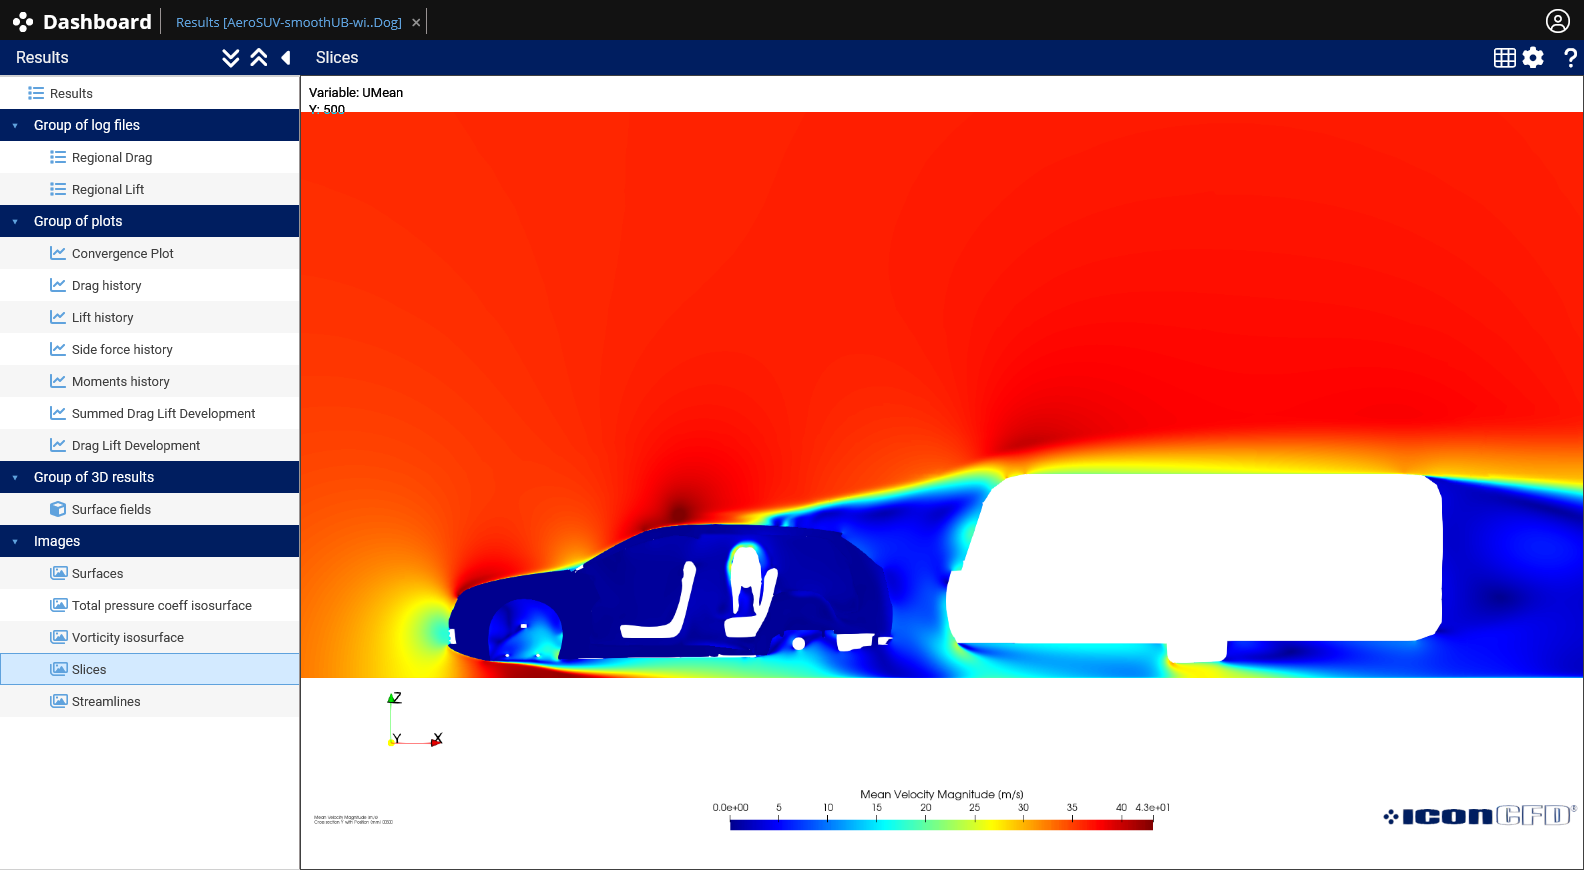
Velocity Magnitude – Y Axis (Y=500mm)
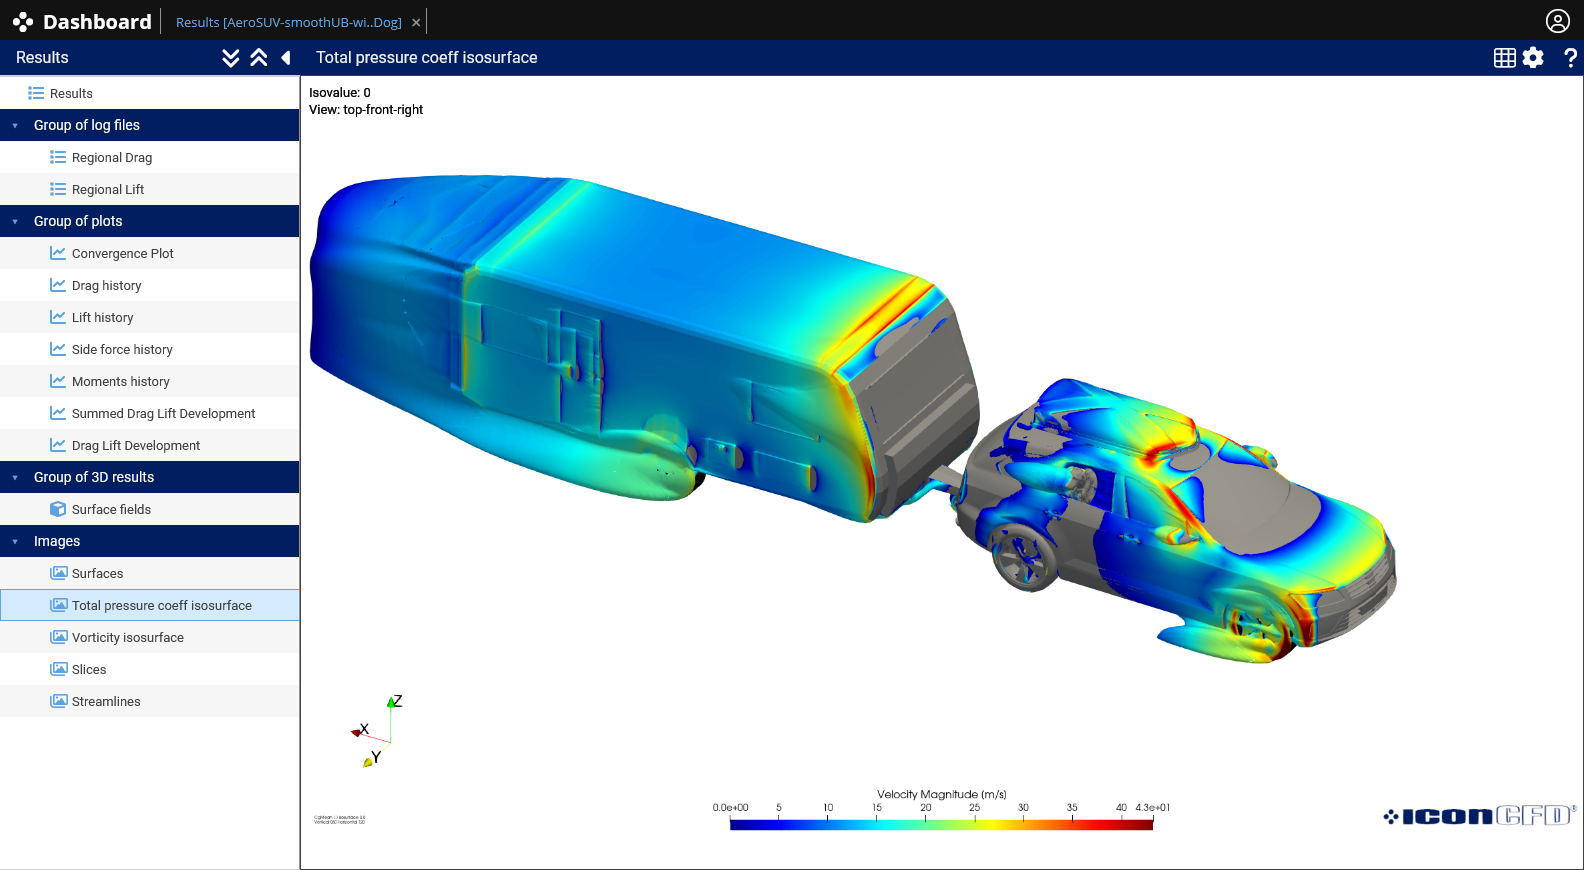
Total pressure isosurface coloured by velocity magnitude
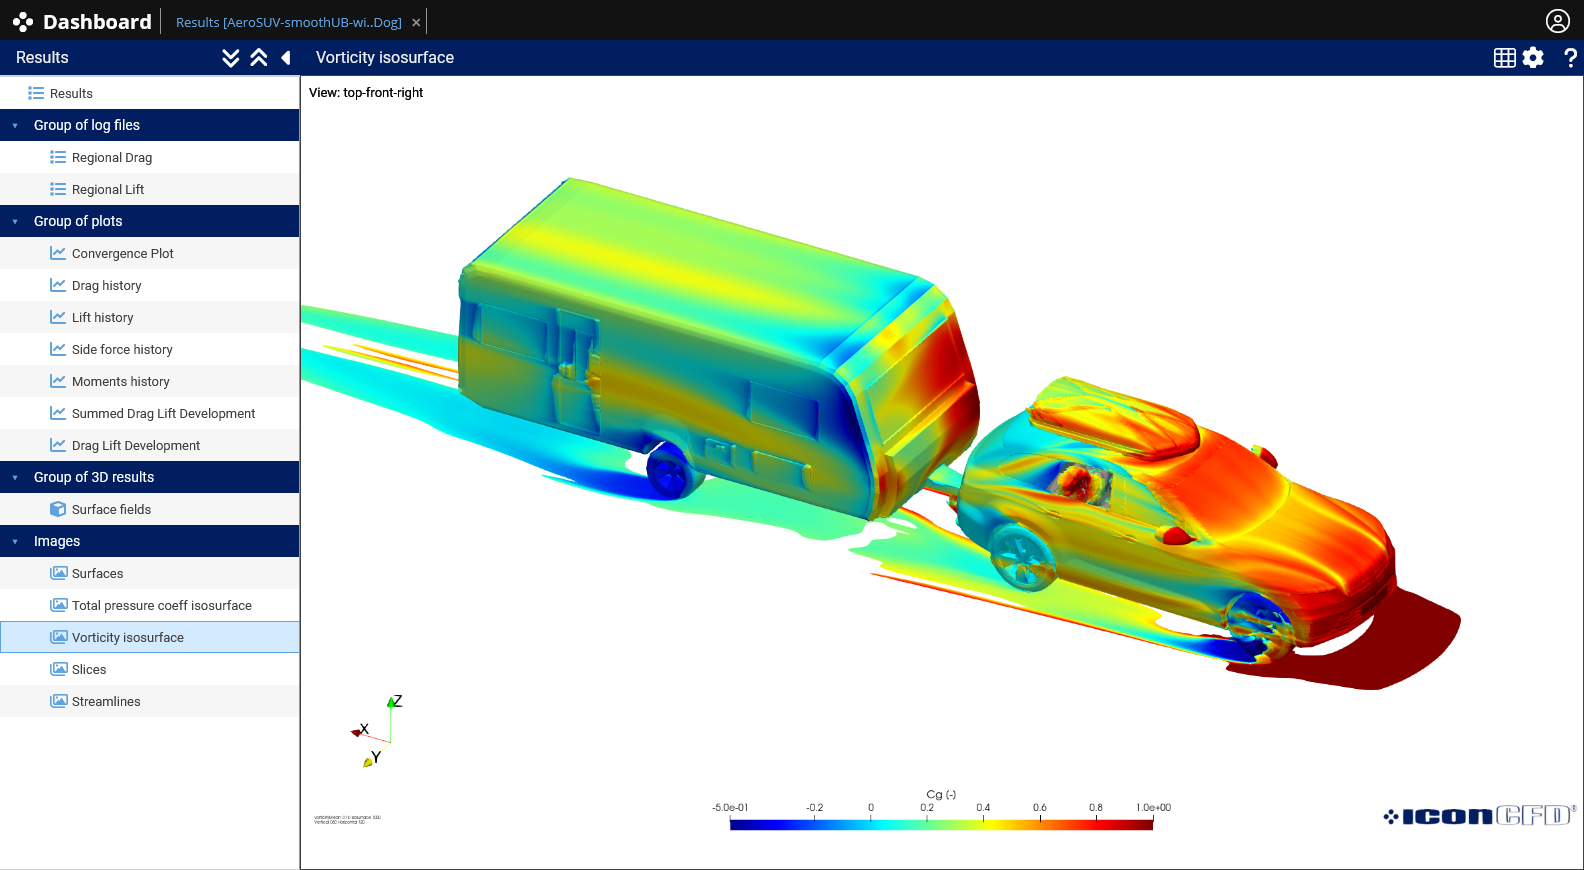
Vorticity isosurface coloured by total pressure
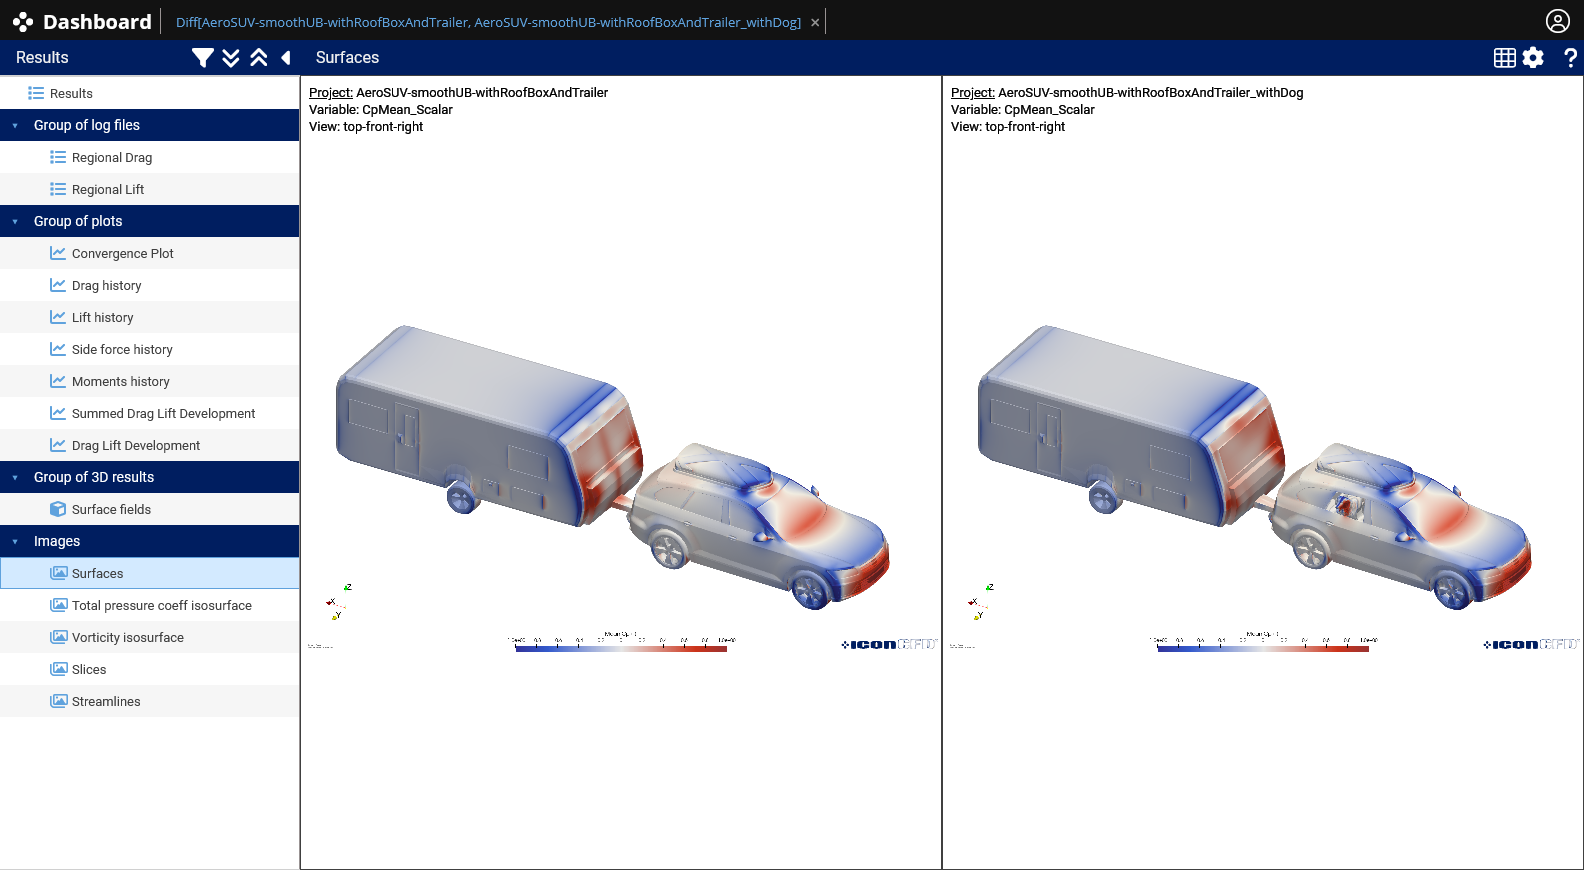
Surface pressure – Scenarios 3&6 Comparison
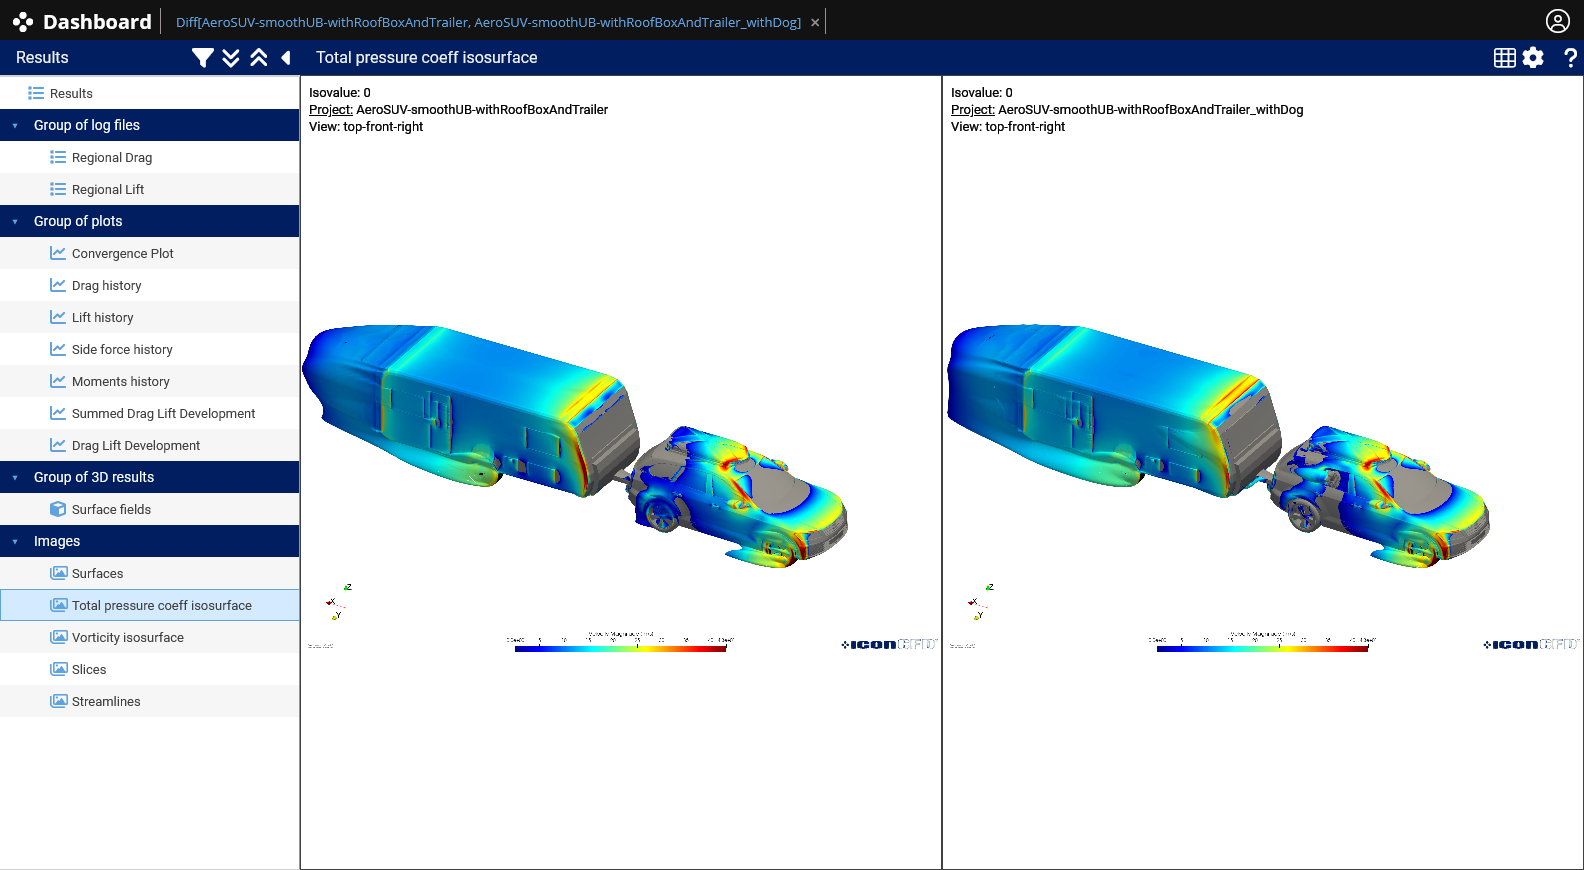
Total pressure isosurface coloured by velocity magnitude – Scenarios 3&6 Comparison
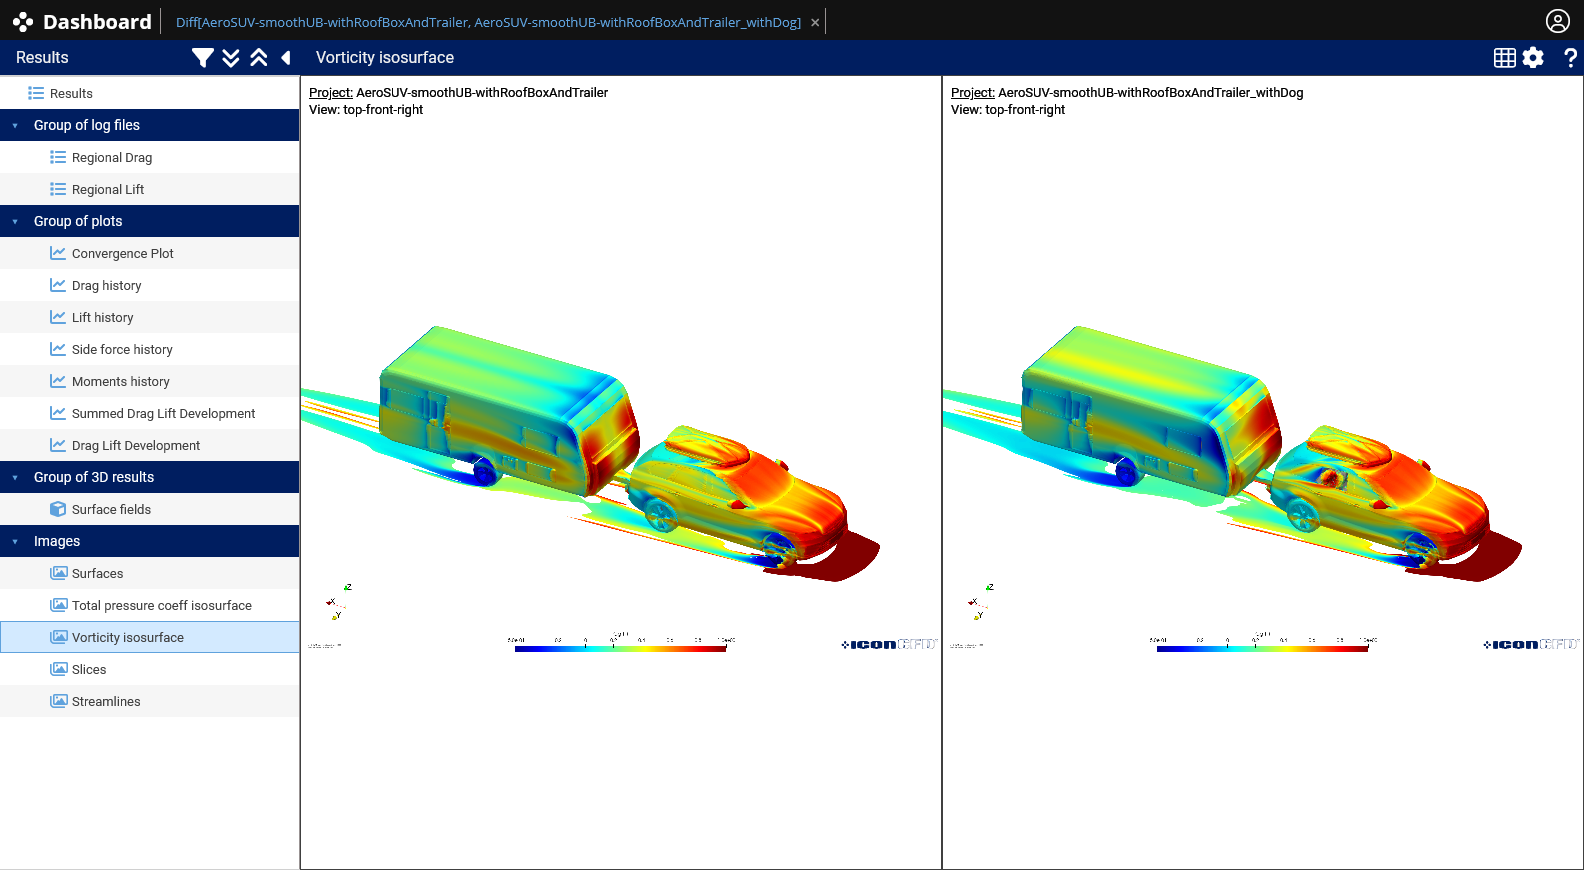
Vorticity isosurface coloured by total pressure – Scenarios 3&6 Comparison
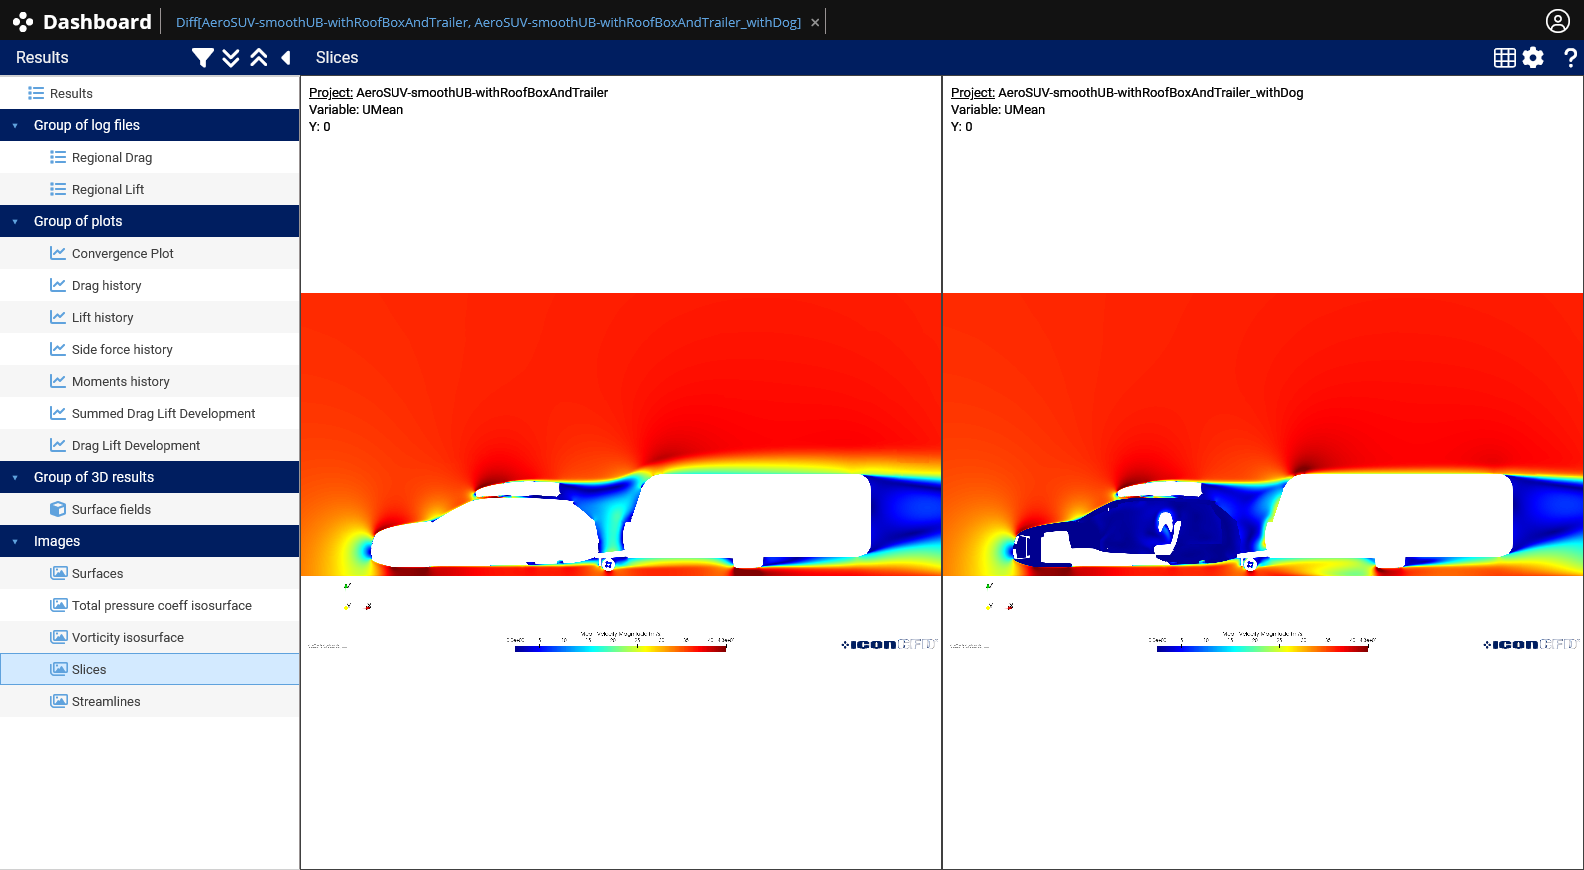
Velocity Magnitude – Y Axis (Y=0) – Scenarios 3&6 Comparison
Scenario 6 Drag coefficient:
| Car + rooftop box + caravan + pet | Cd = 0.690 | +147.31% vs baseline |
What’s Next
By entering the promotional giveaway you have the opportunity to run one case of your own on iconPlatform – One winner will be selected weekly and given access to upload their own vehicle geometry and see the results generated for a configuration that really matters.
| Book a CFD consultation → |
Already know what you need? Buy a token pack directly →
ICON Technology & Process Consulting Ltd – holidays2026.iconcfd.com/
You are receiving this email because you registered for the #ICONholidays campaign. Privacy policy | Unsubscribe
