Managing and Deploying Applications Seamlessly in IconPlatform

At ICON Technology & Process Consulting, our goal is to simplify how engineers and scientists build, execute, and monitor simulation workflows. Following our previous article on the Inputs tab, this post explores the Apps and Projects sections of the iconPlatform — where users add, configure, and execute the computational tools that power their workflows.

Overview

An App is a processing brick that takes some input and produces output, according to user provided parameters. The Apps tab shown below is used to register and update apps:

Figure 1: App tab, showing the version of an application

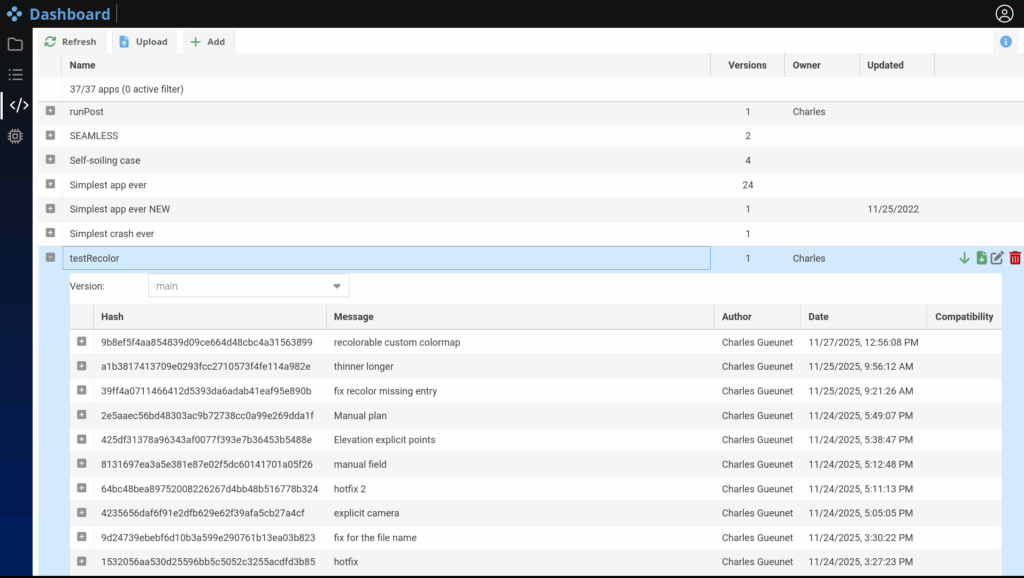
The git integration allows to fetch the last changes and visualize branches and commits.

From simple scripts to distributed solvers, every app can then be executed on the desired resources directly from the browser, in the Project tab. Each app is fully integrated with the platform’s data management system, ensuring a seamless link between inputs, computation, and results.

Figure 2: Project tab, showing the status of several projects

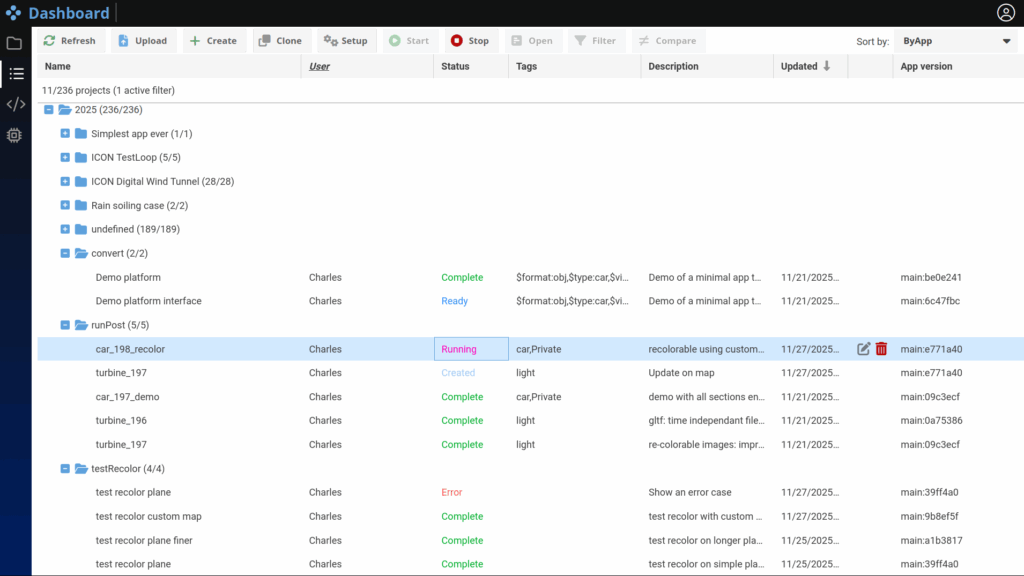
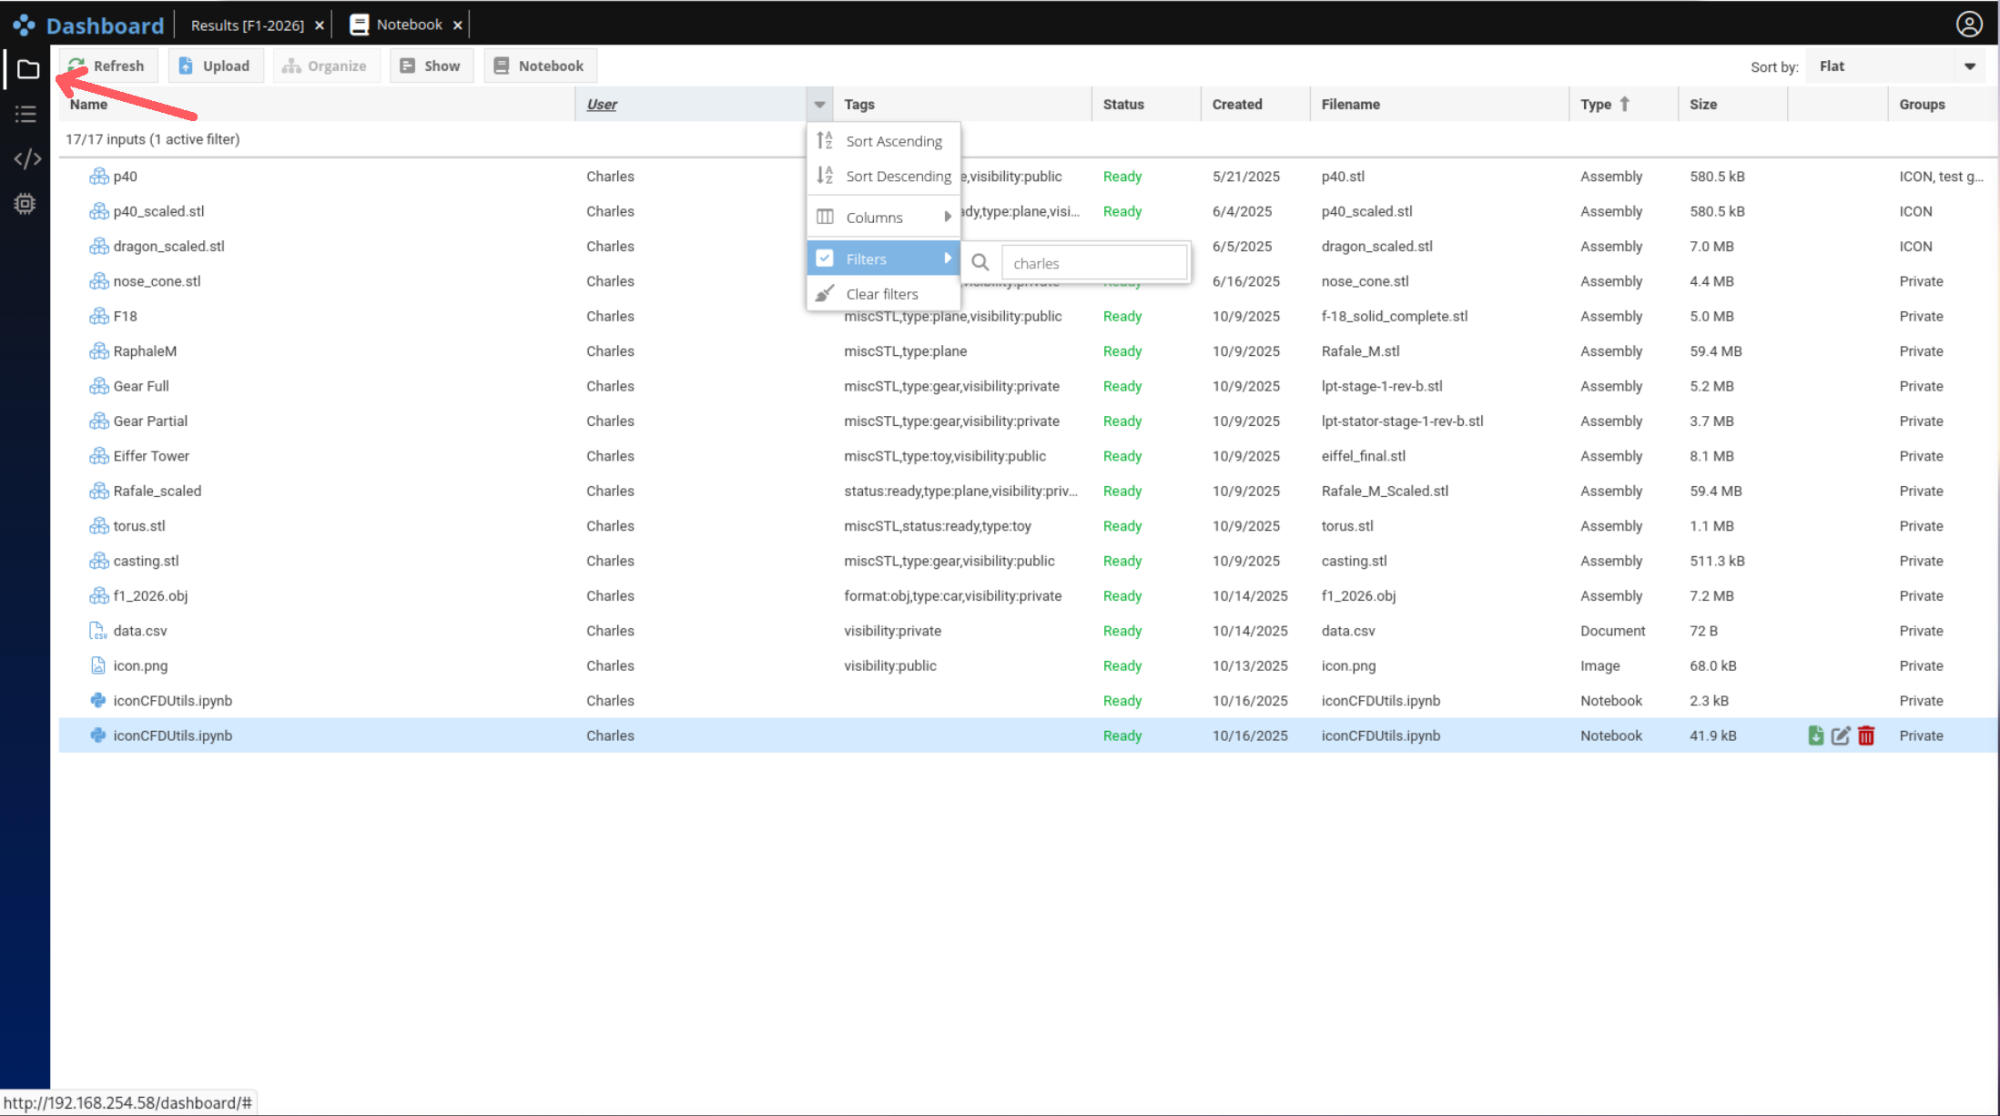
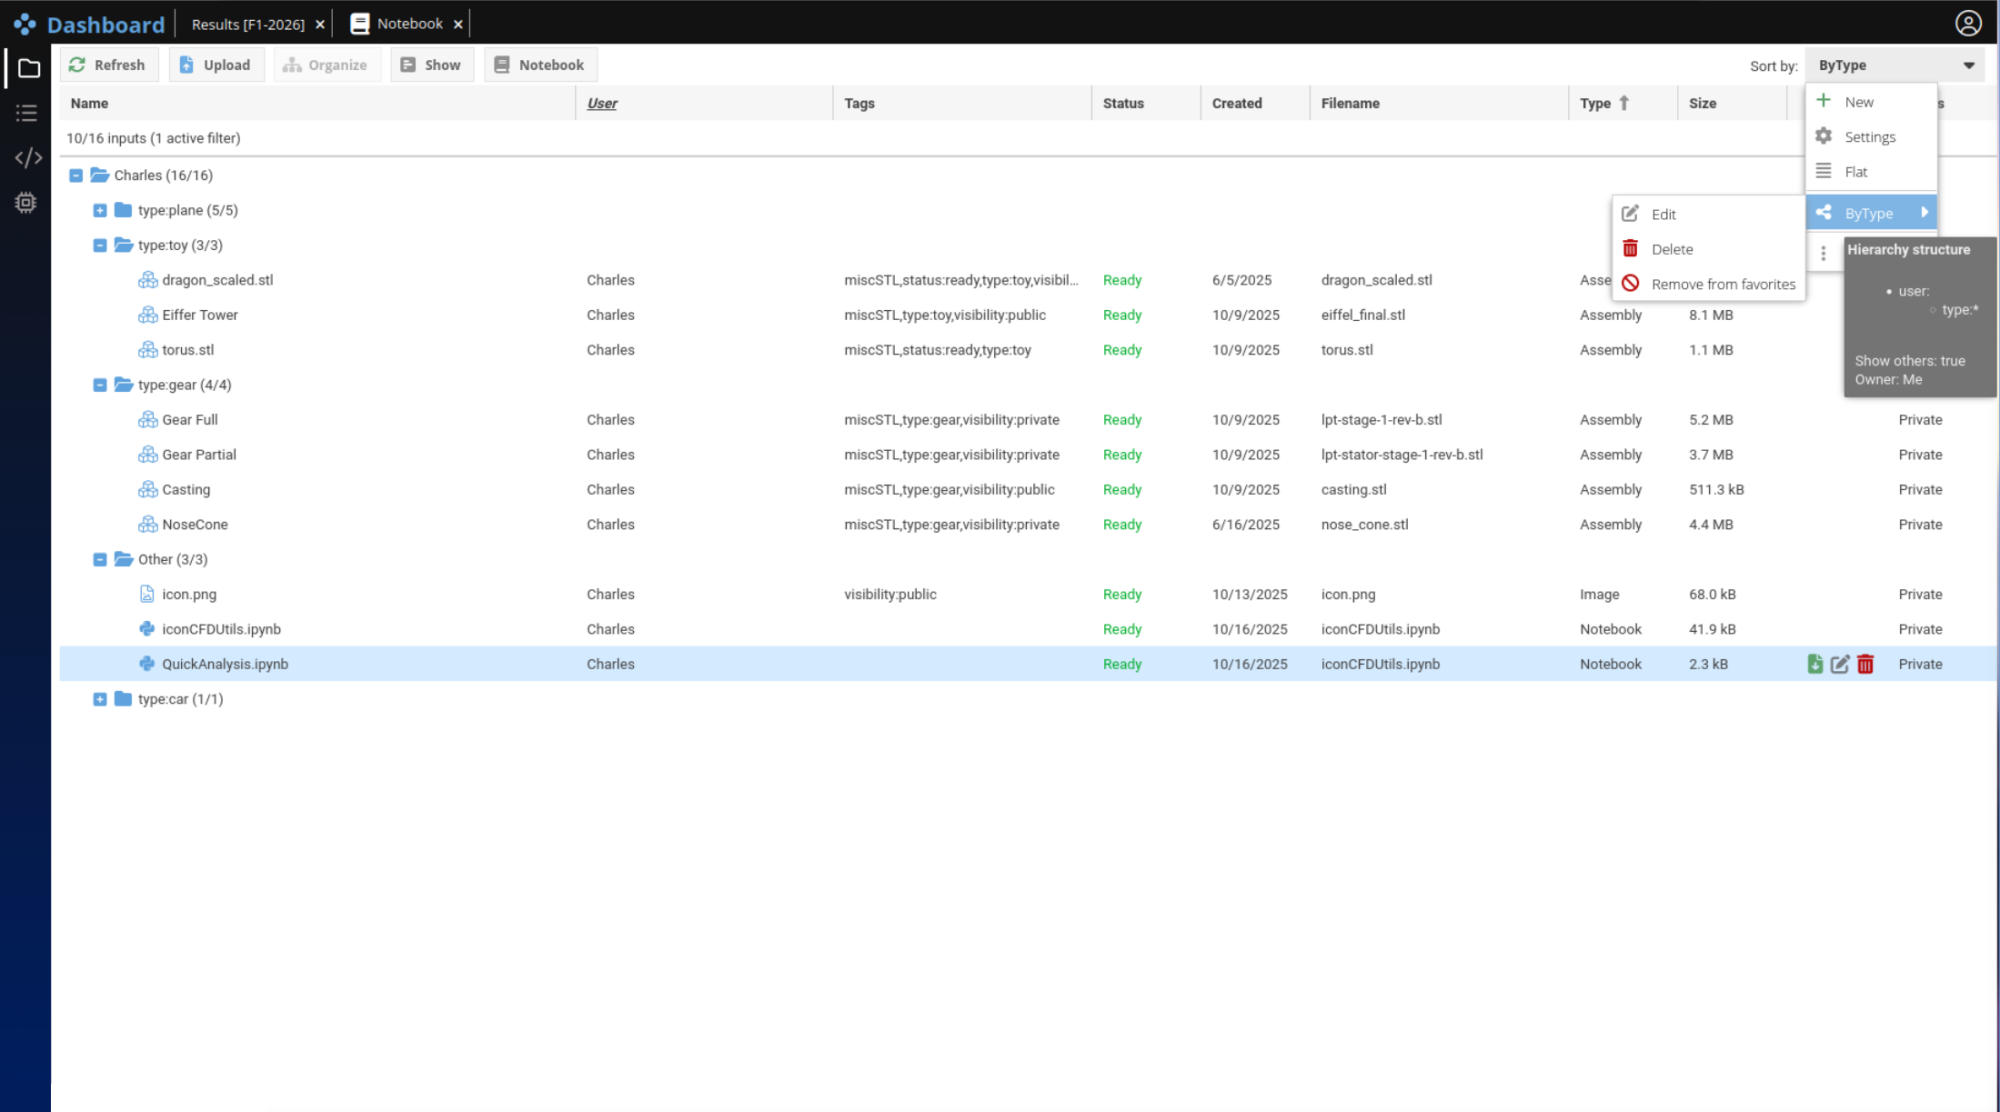
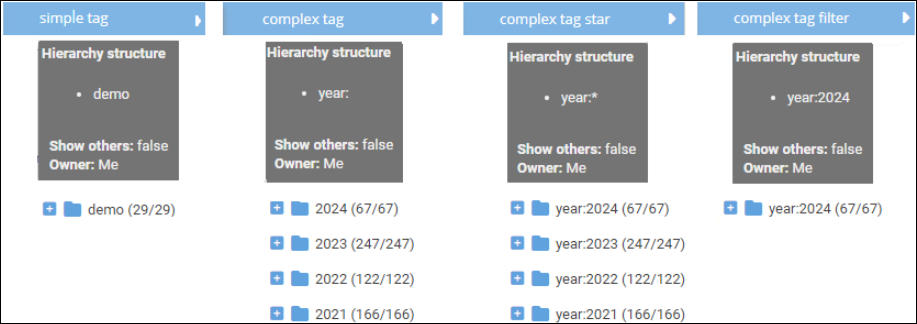
As for the Input tab previously described here, the Project tab supports custom hierarchies based on tags, enabling flexible organization and fast retrieval. Additionally, each app instance has a clearly defined status indicator, indicating if it is: Ready, Running, Stopped, Completed or in Error state.

Defining an App

Any software, script, or command-line tool can be turned into an iconPlatform App with minimal effort.
To do so, you only need to provide a simple JSON manifest named app.json that defines:

  • Application name and description
  • Resource requirements (CPU, memory, GPU, etc.)
  • Executable or entry point
  • Optional input parameters (files, numerical values, toggles, etc.)

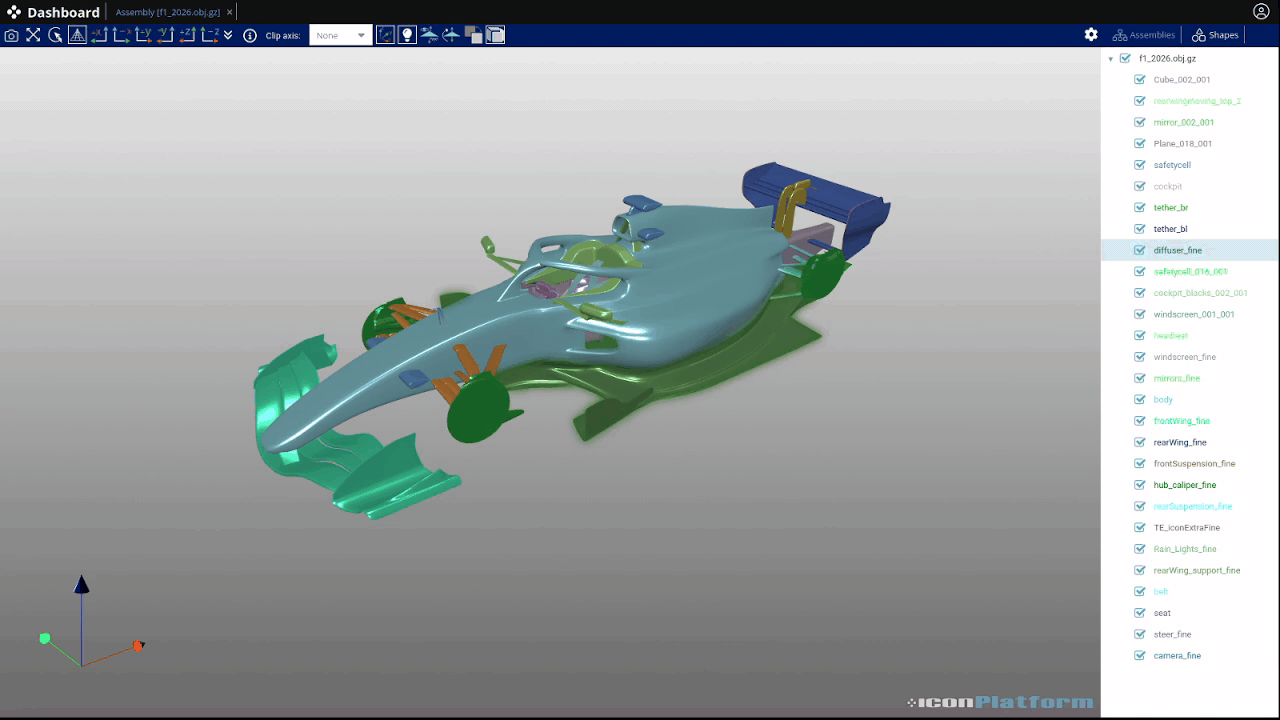
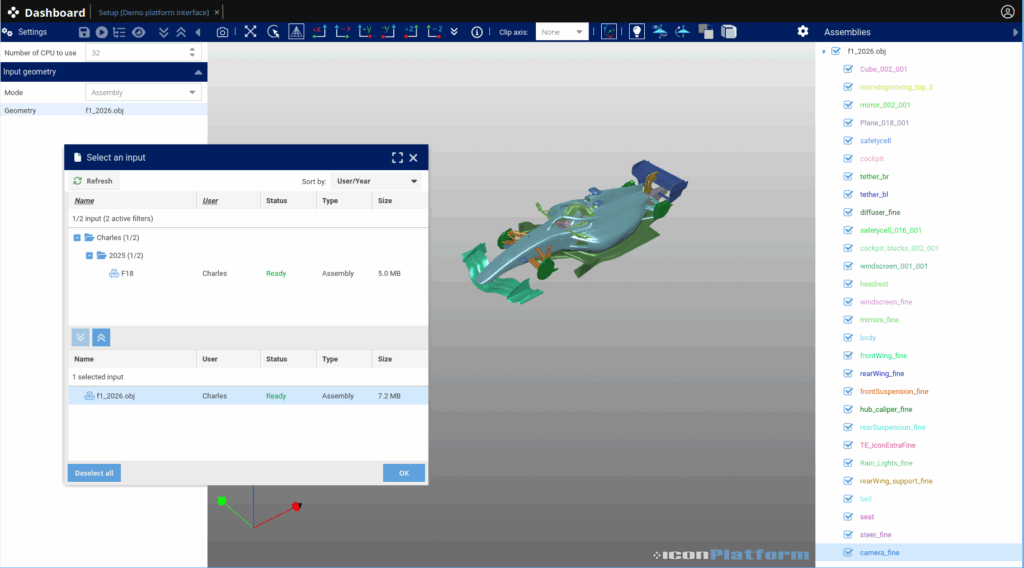
In order to illustrate what such file may looks like, we will use a small converter application that takes any surface as input and generates a 3d gltf output that can be explored directly in the platform. The input of this application can be an assembly from the object store or a path on the remote filesystem. From the app.json file, iconPlatform will create an interactive user interface to configure each instance of the app.

Expand the app.json of our convert:
{
  "$schema": "http://iconPlatform.tld/schemas/app.json",
  "mandatory": true,
  "flatten": false,
  "name": "convert",
  "entryPoint": "runConvert.sh",
  "resultDir": "results",
  "requirements": {
    "software": {},
    "hardware": {
      "minMPIRanks": 8,
      "minTotalRAMGB": 4
    }
  },
  "options": [
    {
      "name": "input",
      "displayText": "Input geometry",
      "type": "group",
      "options": [
        {
          "name": "mode",
          "displayText": "Mode",
          "type": "combobox",
          "default": "Assembly",
          "choices": [
            "Assembly",
            "Path"
          ]
        },
        {
          "name": "file",
          "type": "inputFile",
          "subTypes": [
            "Assembly"
          ],
          "displayIf": "@root.input.mode=='Assembly'",
          "displayText": "Geometry",
          "toolTip": "Add the required input geometry (from the Input tab)"
        },
        {
          "name": "path",
          "type": "string",
          "default": "",
          "displayIf": "@root.input.mode=='Path'",
          "displayText": "Geometry path",
          "toolTip": "Add the required input geometry (from remote the filesystem)"
        }
      ]
    }
  ]
}


This app allows the user to provide an input file either using a path (string) or by selecting a file. Here is the corresponding interface for this simple example:

Figure 3: Execution setup with a 3D input

A second JSON file is used describe the output schema, allowing the platform to automatically generate another interface to explore the results:

Expand example autopost.json:
{
  "$schema": "https://iconPlatform.com/schema/autopost.json",
  "name": "AutomaticPost",
  "results": [
    {
      "type": "3d",
      "name": "result",
      "file": "result/result",
      "toolTip": "Explore"
    }
  ]
}


This metadata-driven approach decouples the platform from specific solvers or environments: any executable or solver can become a platform-ready App.

Dynamic Behavior

IconPlatform uses a templating system to make applications fully modular and context-aware. This means apps can dynamically adapt their configuration based on information from:

  • Input data (eventually from previously executed workflows)
  • User-provided parameters
  • Environment variables (including job IDs, cluster settings)

For instance, here is the entry point script of our convert application. This script retrieves the environment information (including the MPI commands to use) from the templating system to launch the data processing in a distributed fashion. User provided parameters like the input data are setup similarly. In this example the main processing is done with pvbatch and a python script.

Expand example runConvert.sh:

#!/bin/bash

# Retrieve the launch command
MPICommand='{{resource.scheduler.mpi.MPICommand}}';
MPIParallel='{{resource.scheduler.mpi.MPIParallel}}';
NUMBEROFCORES='{{data.project.nCPUs}}';
MPIOptions='{{resource.scheduler.mpi.MPIOptions}}';

# Run the processing
$MPICommand $MPIParallel $NUMBEROFCORES $MPIOptions pvbatch --dr --mpi convert.py

Expand corresponding convert.py:

import paraview

from paraview.simple import OpenDataFile, GroupDatasets, ExtractSurface, SaveData

paraview.compatibility.major = 5
paraview.compatibility.minor = 11
paraview.simple._DisableFirstRenderCameraReset()

{{#if (equals project.data.input.mode "Assembly")}}
# Chosen assembly is available here:
import os
folder = "./constant/triSurface"
inputFile = os.path.join(folder, os.listdir(folder)[0])
{{else}}
# Retrieve the path chosen by the user:
inputFile = {{project.data.input.path}}
{{/if}}

# Demo Pipeline
inputData = OpenDataFile(inputFile)
groupDatasets1 = GroupDatasets(registrationName="GroupDatasets1", Input=inputData)
extractSurface1 = ExtractSurface(
    registrationName="ExtractSurface1", Input=groupDatasets1
)
SaveData("results/result.gltf", proxy=extractSurface1)


The templating system uses expressions and control statements enclosed within {{ }} to dynamically insert values or logic. It enables seamless integration of metadata and user driven parameters in the workflow.

VS-Code integration

In order to assist with app development even further, we provide a dedicated VS Code extension that integrates directly with iconPlatform. This plugin exposes the full templating context while editing your app in order to validate your implementation. The extension also provides navigation helpers, useful to tune the templating system to your needs.

Intuitive Interfaces for Inputs and Outputs

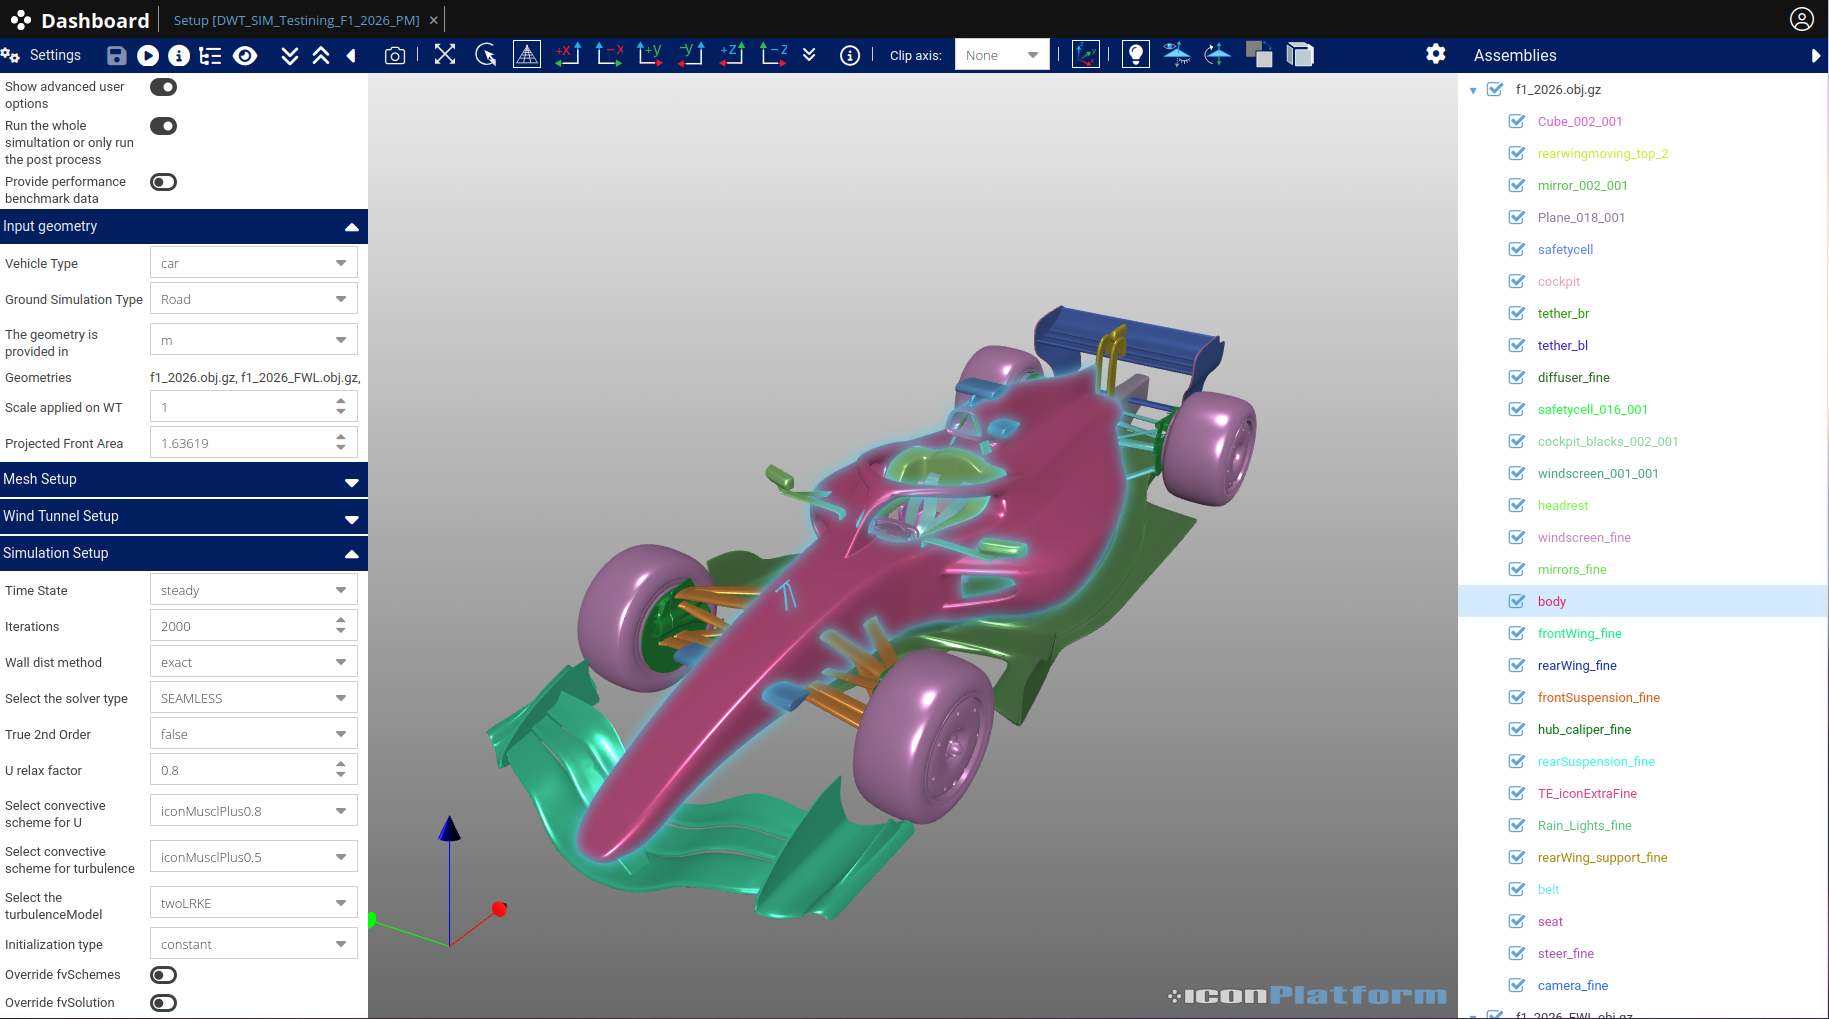
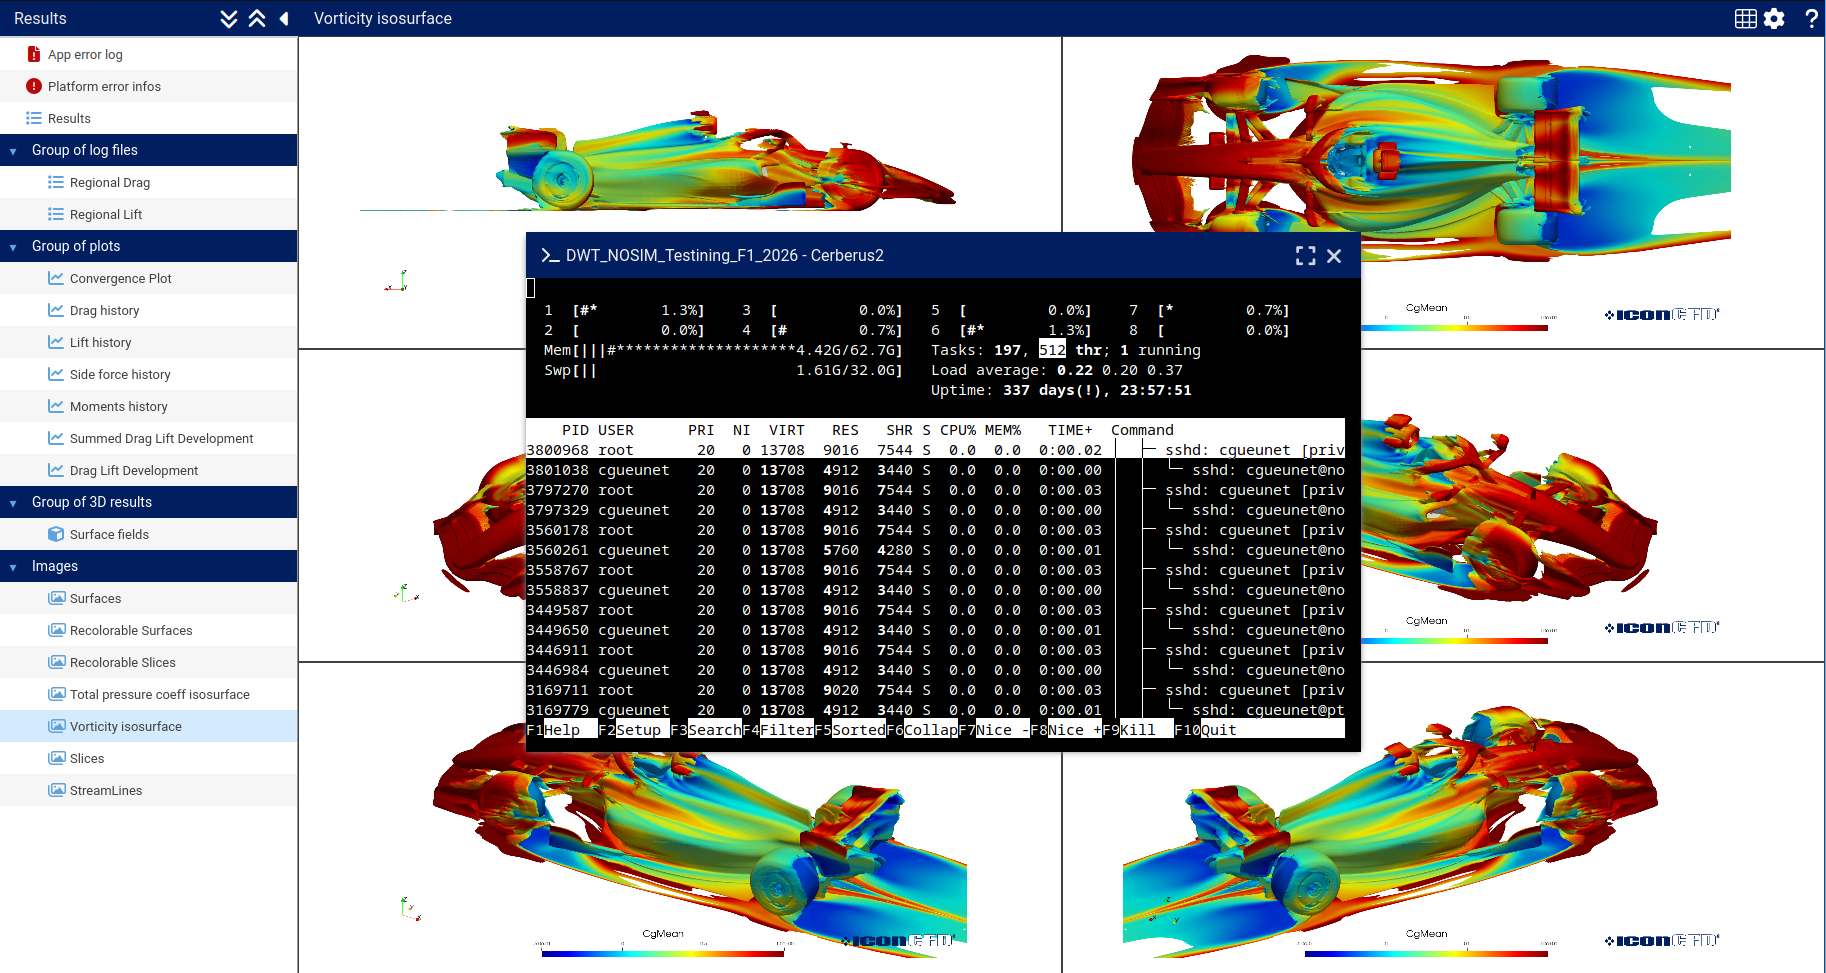
The Project Tab follows the same interface philosophy as the Inputs Tab. Input forms are generated automatically from the application’s JSON manifest (cf. Figure 3). All parameters can be edited, saved, and even reused as templates as initial configuration for future runs. Using output definitions, the platform also creates an interactive results view, allowing users to explore their data directly within the browser.

Regarding input and output, corresponding interfaces make use of our native widgets to create an intuitive user experience. It includes:

  • Interactive viewers for 2D / 3D geometries
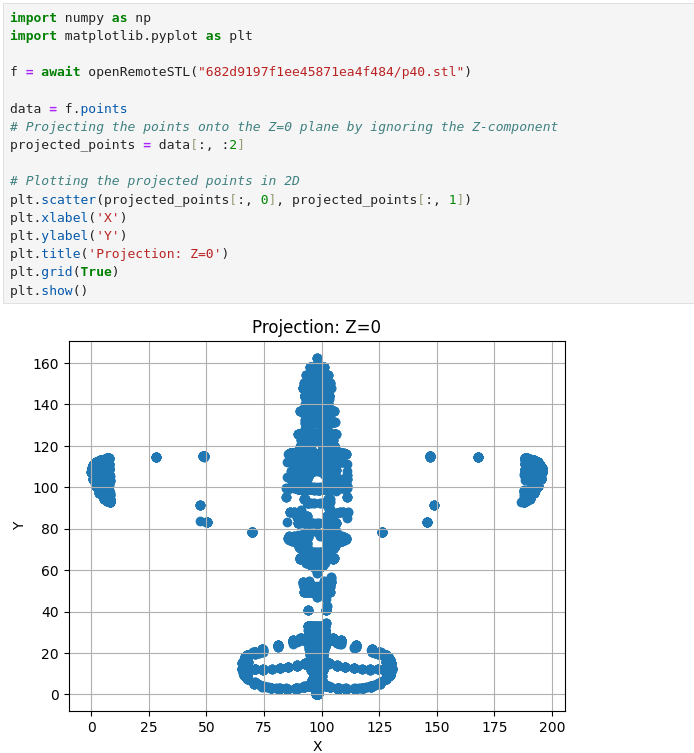
  • Tables, chart and plots for numerical results
  • Parametric exploration interface to browse collections of generated images by varying parameters such as: camera position, displayed fields, simulation settings, or any other configurable inputs.
  • Log file access and run metadata

This approach ensures a consistent user experience throughout the simulation workflow, for initial configuration to result exploration.

Seamless Distribution and Execution

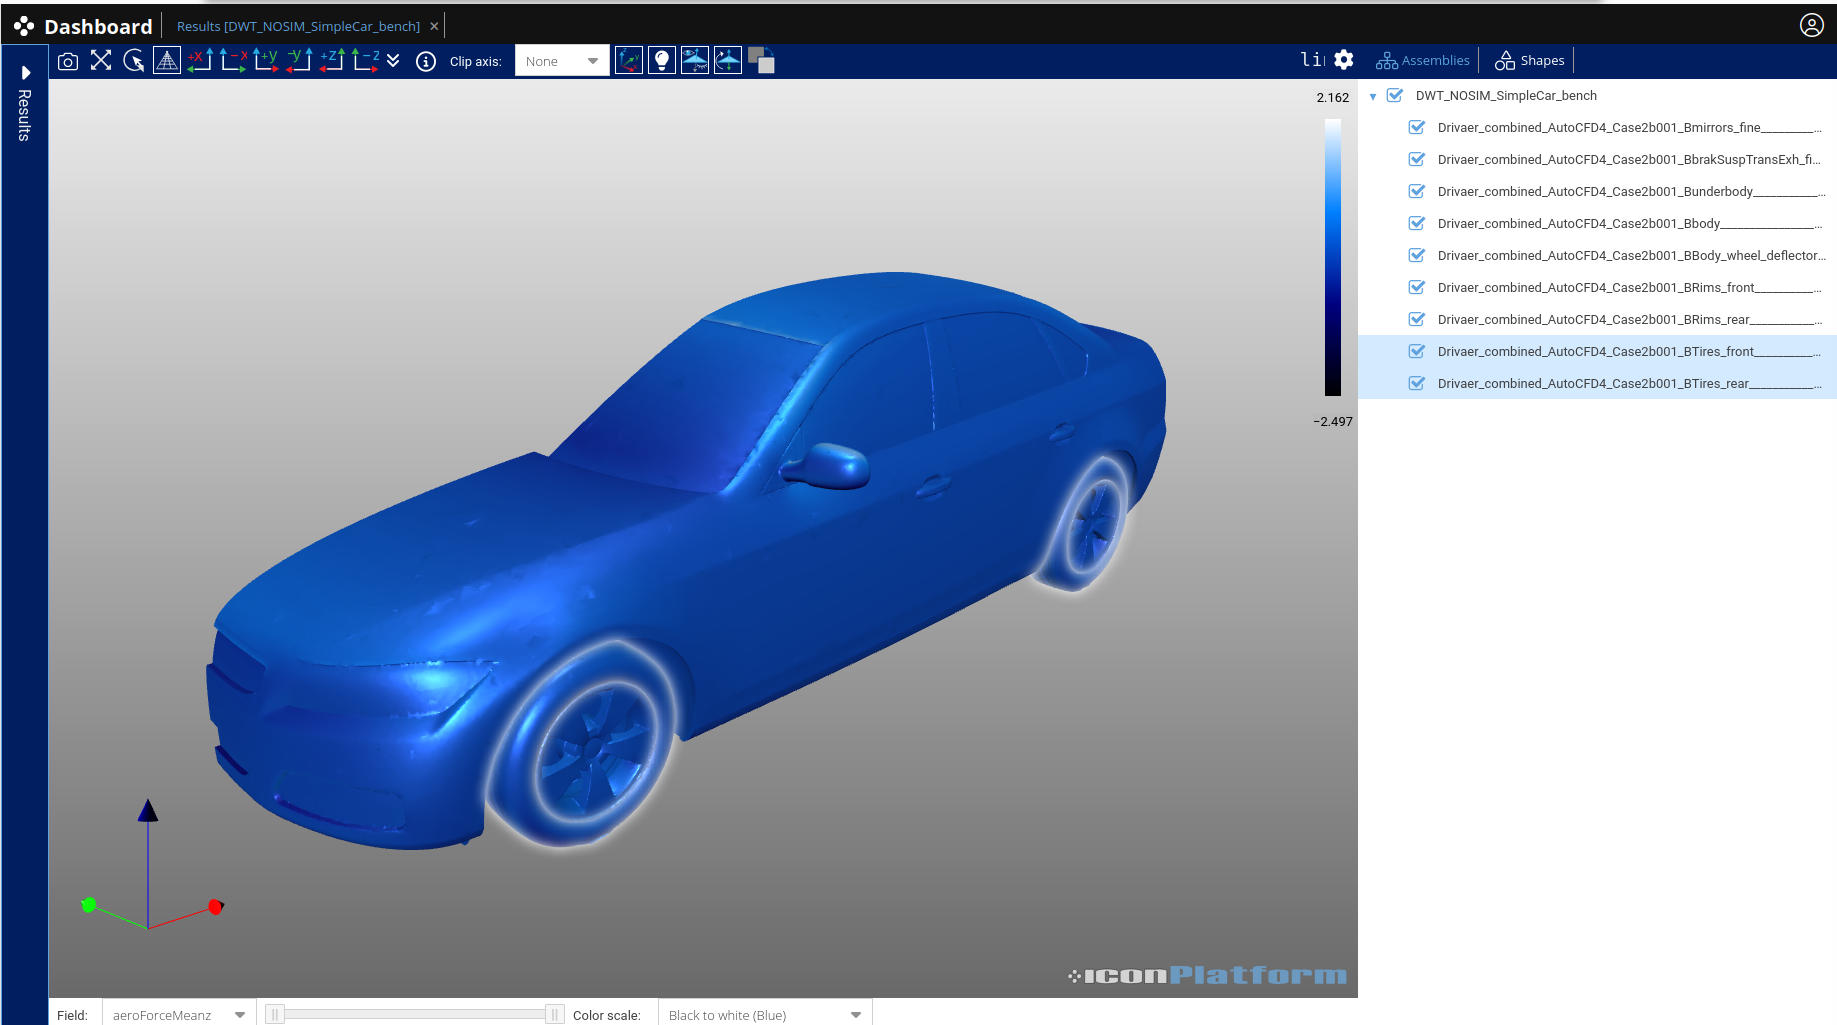
An app configured by the user along with the corresponding data is named a Project, hence the name of the Project Tab. Projects can be executed across any computational infrastructure, from a single node to large-scale HPC clusters, without users needing to manage low-level details. In this regard, iconPlatform natively integrates with major workload managers such as Slurm and LSF. As seen in Figure 2, the status of each app is reported in live.

This Project Tab is the main interface for project configurations, job submissions, environment setup, as well as status and error reporting.

Design Philosophy

The Apps system follows the same guiding principles as the rest of iconPlatform:

  • Simplicity — minimal metadata required to define complex workflows.
  • Scalability — automatic handling of distributed workloads.
  • Modularity — template-based definitions for flexible integration.
  • Transparency — clear states, reproducible runs, and browser-native visualization.
  • Customizability — user provided filters and hierarchies.

This design empowers users to transform their existing tools into integrated apps — without modifying the underlying code.


Learn More

To learn more about iconPlatform and how it can streamline your engineering simulations, visit:
🔗 https://www.iconcfd.com/contact-us/

Input management: the object store

Following our series of blog on iconPlatform, this one focuses on data management: the Input Tab.

An object store is a data management service designed to store information as discrete entities called objects, rather than using the hierarchical structure of traditional file systems. Each object typically includes the data itself, associated metadata, and a unique identifier, making it easy to access and organize large volumes of data without depending on directory paths. Popular cloud-based examples include Google DriveInput management: the object store, Amazon S3, and iCloud.

Object stores are particularly well-suited for managing large, data. Common features include:

  • Scalability — the ability to efficiently store and retrieve very large data.
  • Access control — fine-grained permission management to ensure secure collaboration.
  • Data consistency and durability — objects remain accessible and uniquely identifiable even if users reorganize or relocate them within their personal or project hierarchy.

While these solutions are popular—and often used for storing personal data such as documents or holiday photos—their core features also make them highly suitable for scientific data management, especially when the object store is deployed close to the simulation infrastructure. Building on this foundation, a scientific visualization–oriented (“SciViz”) object store can extend traditional capabilities with domain-specific functionalities.

A representative example is Girder, an open-source data management platform designed for scientific workflows. Girder provides a plugin architecture that allows users to integrate custom data-processing pipelines or extend visualization capabilities. For instance, the DICOM plugin to extract slices from DICOM (medical) volumetric datasets and display them along with their associated metadata:

DICOM view in Girder, from the official documentation


While existing solutions are useful for lightweight data processing, they are not designed to manage an entire simulation workflow including meshing, solver execution and post-processing.

That’s where the object store of our solution (iconPlatform), accessible through the Input tab, comes into play.
It serves as a full-featured object store, and is seamlessly integrated into the simulation environment. Here is a basic view of the interface, with a filter to display only the data of a single user:

As you can see, in this tab all available datasets are presented together with metadata such as the owner, data type, and size. Permissions are managed through user groups. Instead of a flat array, is is possible to show the data using a custom hierarchy, based on any metadata including but not limited to custom tags.

Indeed, unlike traditional hierarchical file systems, the object store identifies data objects independently of their physical location. Our platform takes advantage of this flexibility by using tags to create dynamic, virtual hierarchies. It is thus possible to organize data using various hierarchies, for example User/Type as shown in the previous image. Since these tags are fully user-defined, you can easily design your own navigation schemes, filtering and sorting data to match your workflow and scientific context.
Here is an extract of the documentation on how to define your own hierarchy:

As an abstraction above the standard hierarchy based classification, this label-based navigation system enables intuitive, personalized and flexible data organization. For example, in a multi-physics MDO context, each step in the workflow will augment the previous step with its own set of tags enabling quick comparison between parameter sweeps and clear history of the data.
In addition, this object store benefits from all the iconPlatform’s visualization capabilities, including interactive 3D viewers for inspecting meshes, fields, and assemblies directly within the browser.

View of a 3d surface including fields and partitions

For data exploration and quick analysis, the Inputs store can be directly connected to a Python notebook environment, making it easy to perform in-place data mining, generate plots, or launch custom scripts without leaving the platform. This environment comes preloaded with essential scientific libraries such as NumPy, Matplotlib, and other commonly used packages for data analysis and visualization. If your workflow requires additional dependencies, they can typically be installed easily on the client side with a simple command.

For more advanced analysis, the system is extensible through apps: modular components capable of handling tasks ranging from lightweight preprocessing to computationally intensive operations. These apps can perform simple actions, such as updating metadata or running quick analyses, or can directly be more complex pipelines. This mechanism allows iconPlatform to handle the entire simulation workflow, including meshing, solver execution, and post-processing.
In practice, this platform is more than an object store: it is a complete simulation environment. Users can trigger entire engineering simulation workflows from pre processing to post processing on the  appropriate hardware, and explore results interactively within the same interface.

Conclusion

Unlike generic storage solutions, the object store within iconPlatform has been purposely built to meet the specific demands of simulation workflows and scientific data management. Its architecture is optimized for storing and exploring large numerical datasets, along with metadata — all of which are common in engineering and CFD applications. By designing our own storage layer (which can leverage the filesystem, amazon S3 or any other object store) we ensure an intuitive navigation and a tight integration with the computation and visualization subsystems of the platform.

Beyond its role as a data repository, the object store in iconPlatform acts as the backbone of the entire simulation workflow, connecting data, computation, and visualization in a single, secure environment. Thanks to the flexible tag-based organization, it goes further than traditional file systems and other object stores. Moreover, iconPlatform can be self-hosted, allowing institutions to maintain full control over their data and ensure confidentiality when working with proprietary or sensitive simulations.

For more information regarding iconPlatform and how to try it on, contact us at: https://www.iconcfd.com/contact-us/


Streamlining Simulation Workflows with iconPlatform

At ICON Technology & Process Consulting, we continually develop and refine tools that enhance the efficiency, scalability, and accessibility of engineering simulations. One such solution is our iconPlatform — a browser-based environment designed to streamline the setup, execution, and analysis of simulation workflows.

Overview

iconPlatform provides a unified interface that integrates data management (object store), applications and ressources orchestration, process monitoring and post-processing exploration within a single web application.
This platform enables users to fully handle their simulations directly from their browser, eliminating the need for local software installation. It can be used from our provided instances, or deployed and self hosted on your environment.

Inputs Management

The Inputs tab allows users to upload, organize, and manage datasets that serve as inputs to simulation workflows. Any data can be uploaded here.

A built-in 3D viewer provides interactive exploration of geometries (like .stl and .obj files).
Tags are used as a flexible alternative to traditional folder hierarchies, allowing for more granular data classification and efficient retrieval in large-scale projects. More details will be provided in a future blog.

Application Management

Within the Apps tab, users can manage their applications: processing bricks ranging from small helper tools to distributed solvers.
Each one is defined using a json file describing its requirements, entry point, and options so the user can configure each run as needed.

Applications can be deployed seamlessly across HPC system, leveraging Slurm, LSF, or any workload manager of your choice if needed.
The platform’s templating system exposes contextual metadata (e.g., simulation parameters, job IDs, environment variables), allowing information to flow in between chained applications.

Process Execution and Monitoring

The Process tab serves as the operational core of the Platform. Here, users combine Inputs and Apps to define workflows, allocate computational resources, and monitor execution in real time. As for the input tabs, processes can be label with tag and displayed using customer defined hierarchies, allowing to classify and filter a large amount of execution easily. The platform provides native integration with job schedulers, fully transparent to the end user.

Result explorations

Once the processing is done, users can leverage built-in visualization and analysis capabilities, including:

  • Interactive 3D visualization of simulation domains
  • Interactive tools to explore database of screenshot
  • Chart and tables using interactive web components

These visualization tools are optimized for both performance and usability, enabling rapid iteration between simulation setup and analysis.

Design philosophy

The iconPlatform architecture is intentionally designed to minimize server-side overhead. Once primary compute tasks (such as mesher, solver runs or post-processing operations) are completed on target HPC clusters, subsequent analyses are executed client-side within the browser environment.

This approach ensures that no additional cluster connections or HPC resource allocations are required during case analysis, leading to more predictable compute costs and improved responsiveness for end users. As a result, engineers can interactively explore and analyze simulation results without incurring further server-side load or queue times.

Related Products

A generic post-processing application designed to automate ParaView pipelines via lightweight JSON definitions is also available. It brings the full post-processing power of ParaView with a simple integration into iconPlatform.

The CFD analysis showcased in this article was created entirely within iconPlatform, demonstrating the seamless integration between data management, computation, and visualization. iconPlatform is not limited to CFD workflows.


Learn More

For more information regarding iconPlatform or iconCFD Post and how it can accelerate simulation workflows and productivity, contact us at:
https://www.iconcfd.com/contact-us/