Estate cars, thanks to their extended rear body shape, generate lower pressure in the wake compared to sedans. While this effect increases drag, it also creates a pressure drop that extends beneath the rear bumper and into the rear underbody area. This accelerates the under-body flow and helps prevent boundary layer separation in the diffuser. The under-body flow then exits more rapidly into the wake, accompanied by a significant upwash.
Accelerated flow through the diffuser and the corresponding reduced pressure near the rear axle, in turn, cause lower rear lift or even down-force on the rear axle. This interaction between wake and under-body flow is one way the upper body shape influences under-body aerodynamics.
An example is the comparison between the DrivAer Sedan and Estate car models. The wake upwash – airflow directed upward behind the Estate, in contrast to the wake behind a Sedan is visualized in the picture below. While the Sedan produces aerodynamic lift, the Estate generates down-force on the rear wheels. Precise calculation of wake pressure is therefore not only essential for accurate drag prediction but also for accurate rear down-force, which is crucial for evaluating ride stability and cornering performance in racing applications.
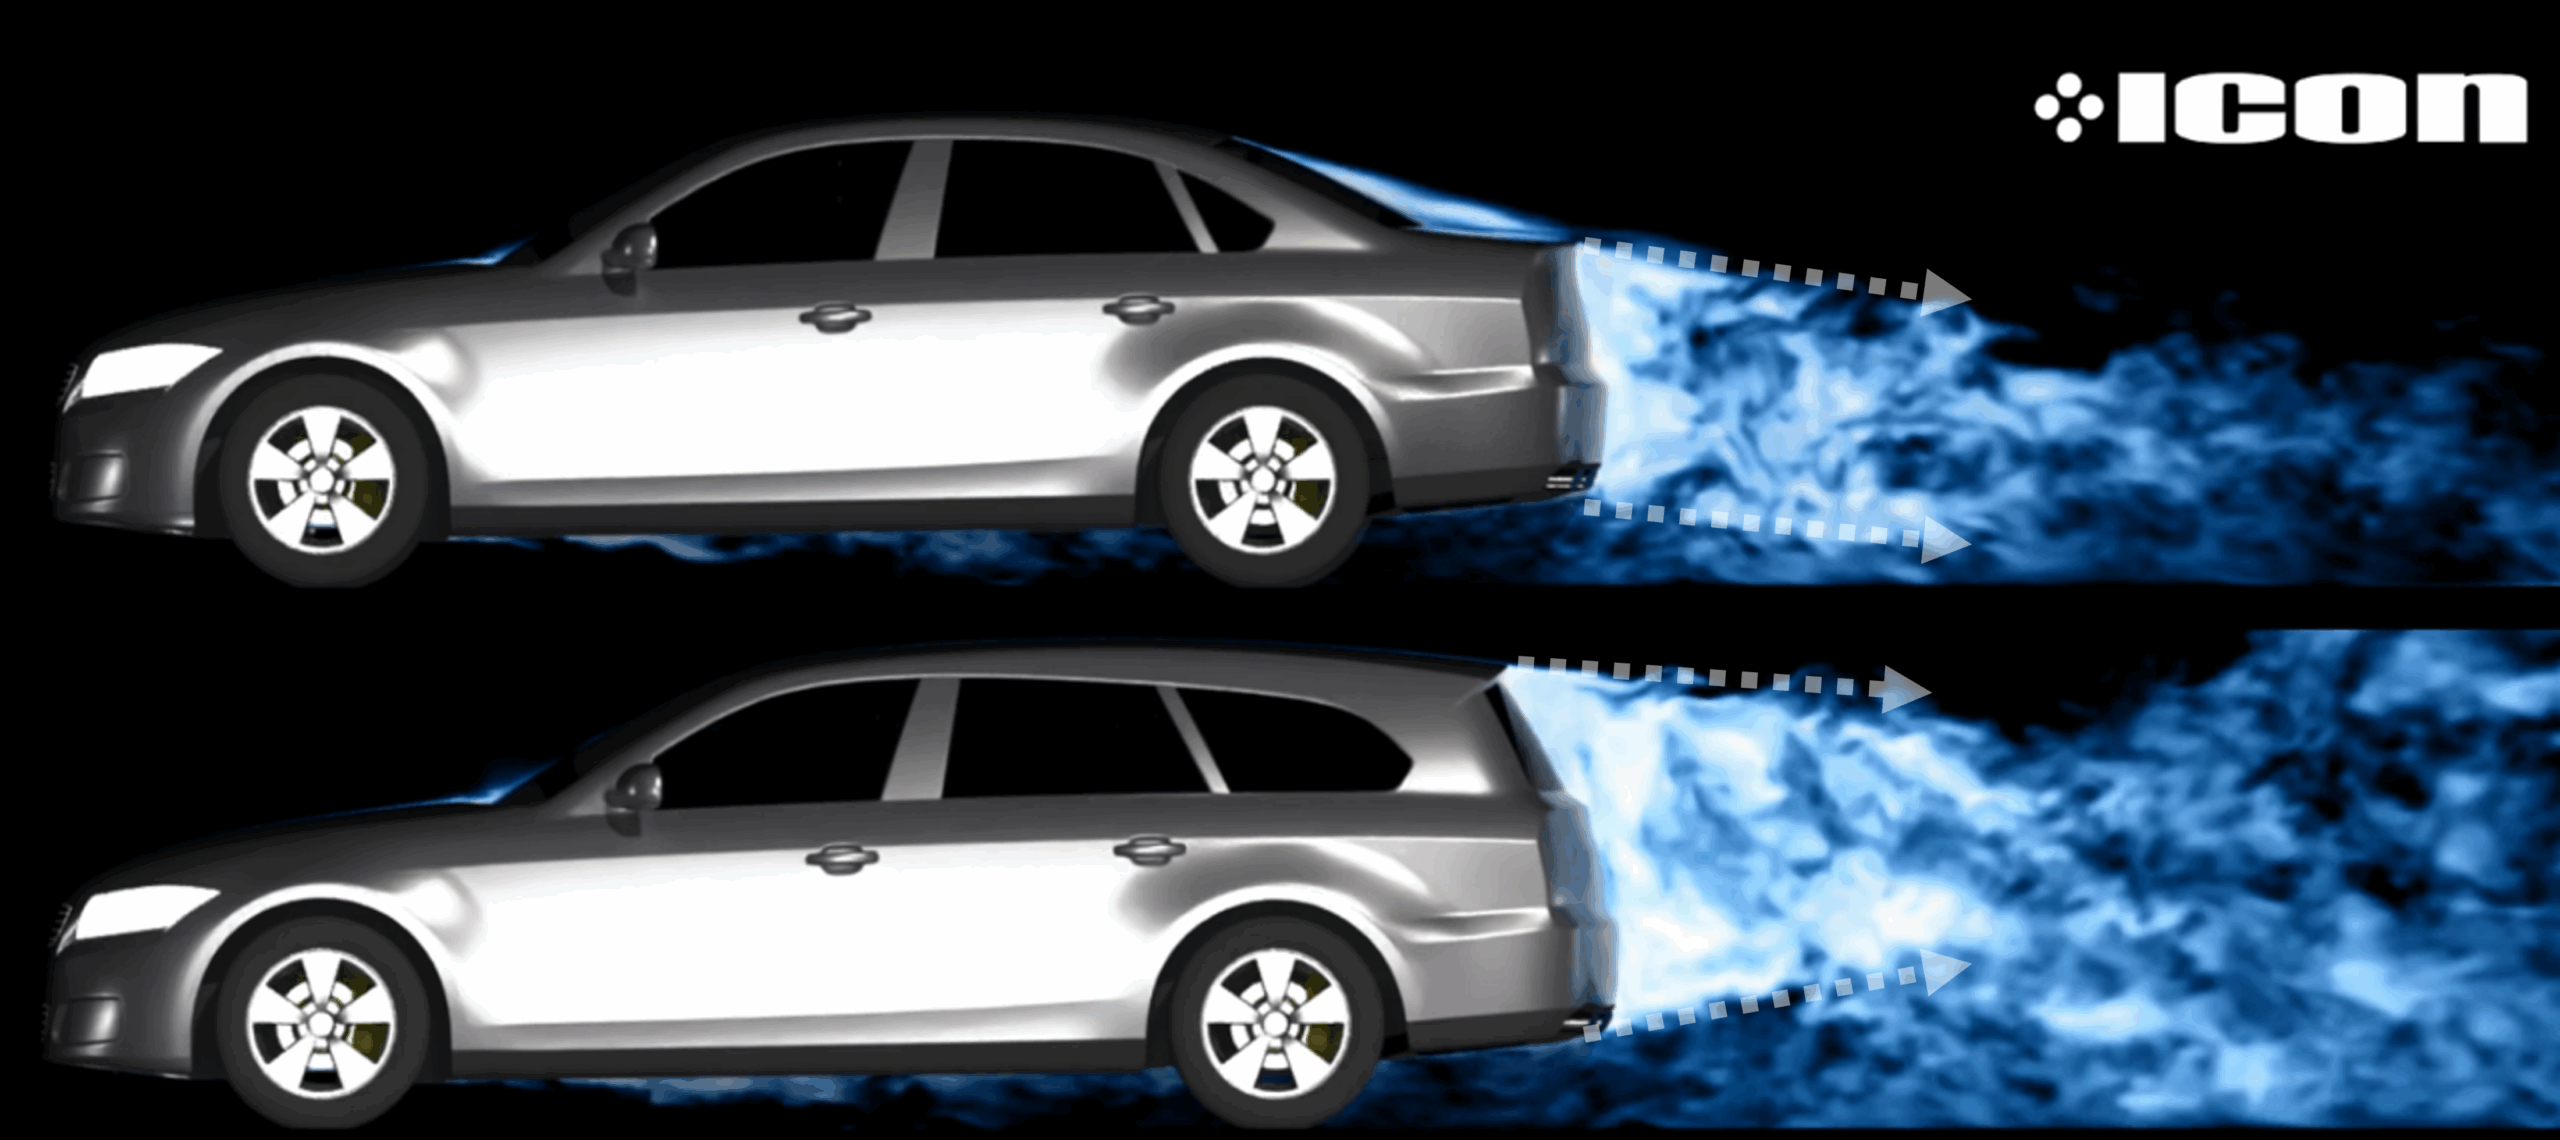
Figure 1: Visualization of the wake behind the Sedan and Estate body types. The DrivAer Sedan wake exhibits a downwash pattern, directed toward the ground, while the DrivAer Estate wake shows a tendency for upwash, with the flow directed upward.
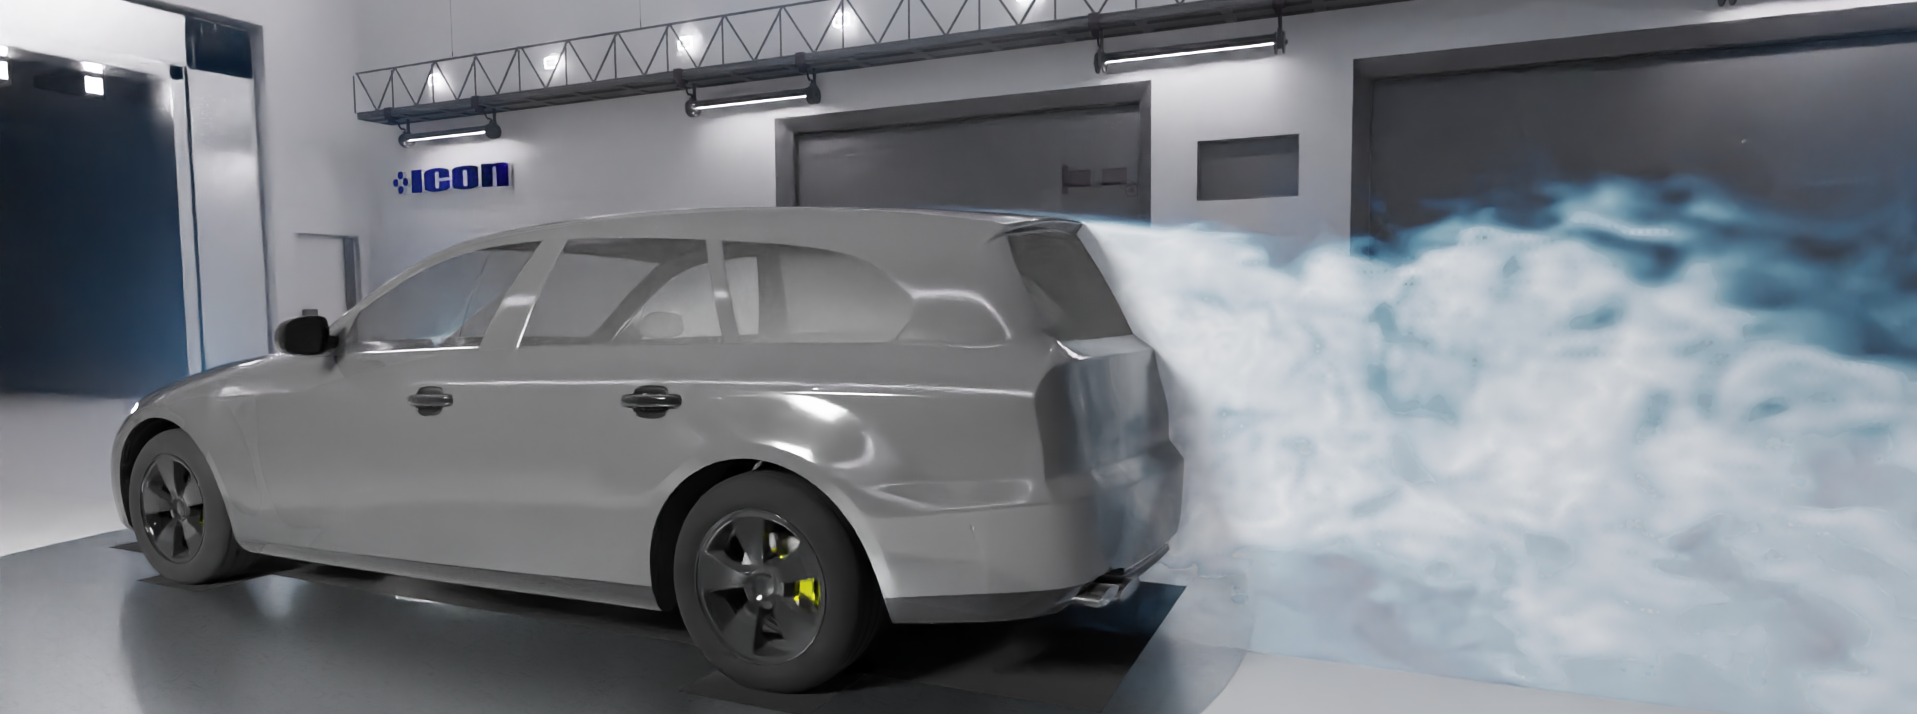
iconCFD is an advanced aerodynamics simulation software designed to accelerate product development through extensive use of high-fidelity digital simulations. The unique simulation capabilities of the iconCFD software are easily accessible remotely via the iconPlatform CFD Simulation Cloud or, alternatively, the software can be installed on‑premise.
iconCFD® allows both steady (RANS) as well as transient (DES/LES) simulations. Although the steady mode is regarded as a fast and reliable method for most engineering tasks, transient iconCFD® simulations are recognized for their uncompromised accuracy. Furthermore, the latest version of iconCFD®, featuring iconSeamlessSolve solver and iconPBMAS (Performance Boost Memory-Aligned Streamlining) technology, delivers a substantial speed-up in transient simulations, enabling high‑fidelity results within just a few hours. The simulation results presented below were generated using iconCFD® v5 in transient DES mode.
Let’s evaluate iconCFD® capability to predict the phenomenon described above: wake–diffuser interaction. We will first examine the pressure on the rear bumper, which can represent the pressure in the wake region, and then look at the rear part of the underbody—the diffuser. The focus will be on the software’s ability to accurately predict the pressure difference between the Sedan and Estate configurations at these two locations.
The DrivAer car model, featuring interchangeable rear body parts to represent Sedan and Estate shapes, was tested in a state-of-the-art, full-scale wind tunnel equipped with a five-belt system including boundary layer suction. Four pressure probes were installed on the lower left part of the rear bumper (shown as blue points) and four on the underbody diffuser (shown as green points in the images below). The car model included two heat exchangers – a condenser and a radiator, and both the lower and upper cooling inlets were open. To eliminate ride height uncertainty, the car model was fixed at a specific ride height using struts.
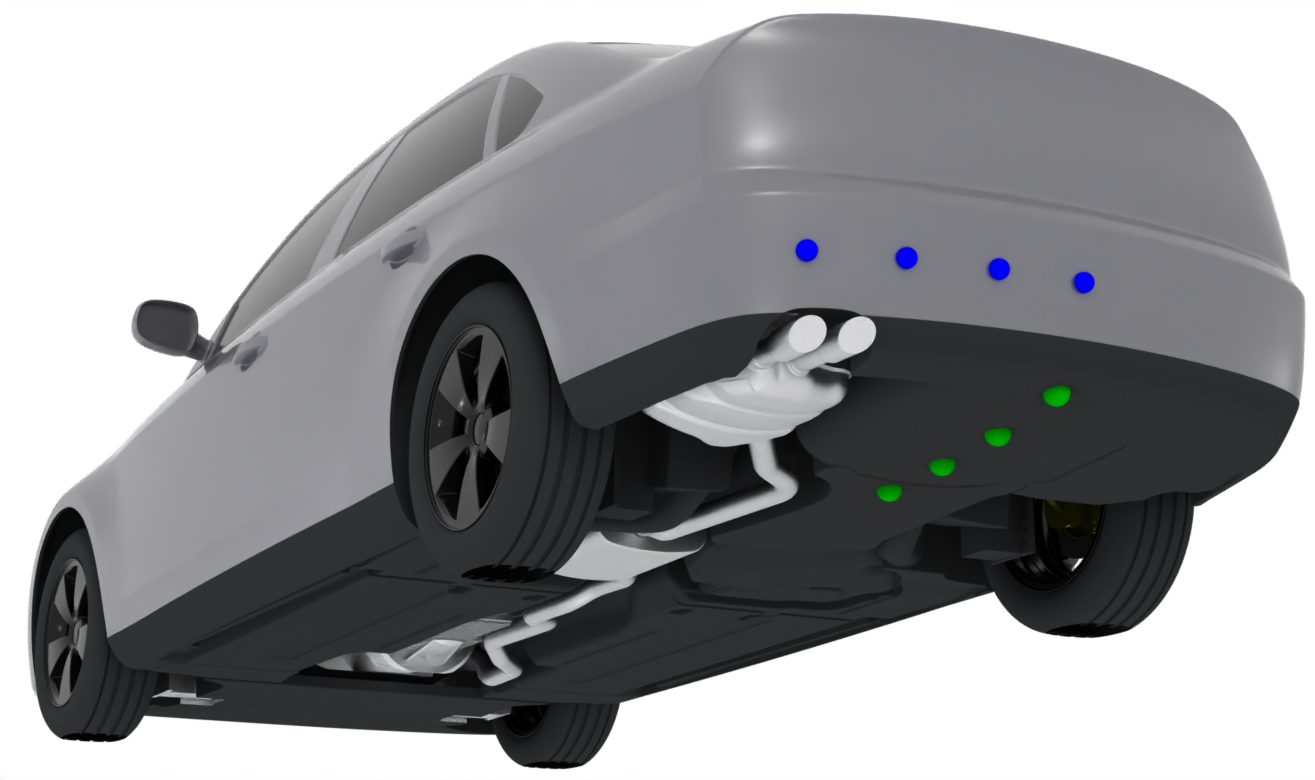
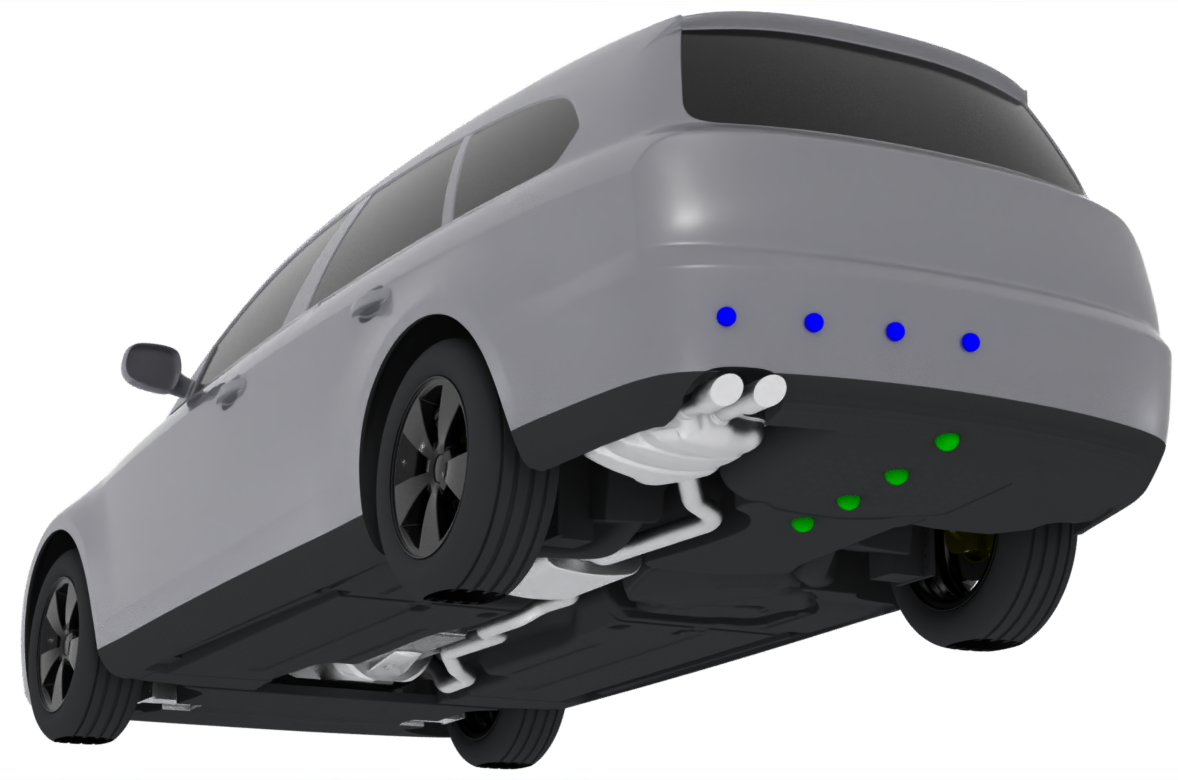
Figure 2: Visualization of pressure probes locations on Sedan and Estate car model. Pressure probes on left half of rear bumper are visualized by blue points. Pressure probes on diffuser are visualized by green points.
Experimental pressure data measured on the lower part of the rear bumper (shown in black) are compared with iconCFD® simulation results (shown in blue) in the figure below. The horizontal axis of the chart represents the Y-coordinate (or lateral coordinate), with the origin at the centerline.
The pressure values for the Sedan configuration (black and blue circles) are noticeably higher at all four locations across the left half of the car compared to the Estate configuration (black and blue squares). The pressure difference between the Sedan and Estate in the wake region on the lower part of the rear bumper is approximately 0.1 Cp.
An important observation is that the pressure differences between Sedan (circles) and Estate (squares), as measured in the wind tunnel (black) and predicted by iconCFD® (blue), are practically identical. This demonstrates iconCFD®’s capability to accurately predict wake pressure and capture the key difference between the Sedan and Estate configurations.
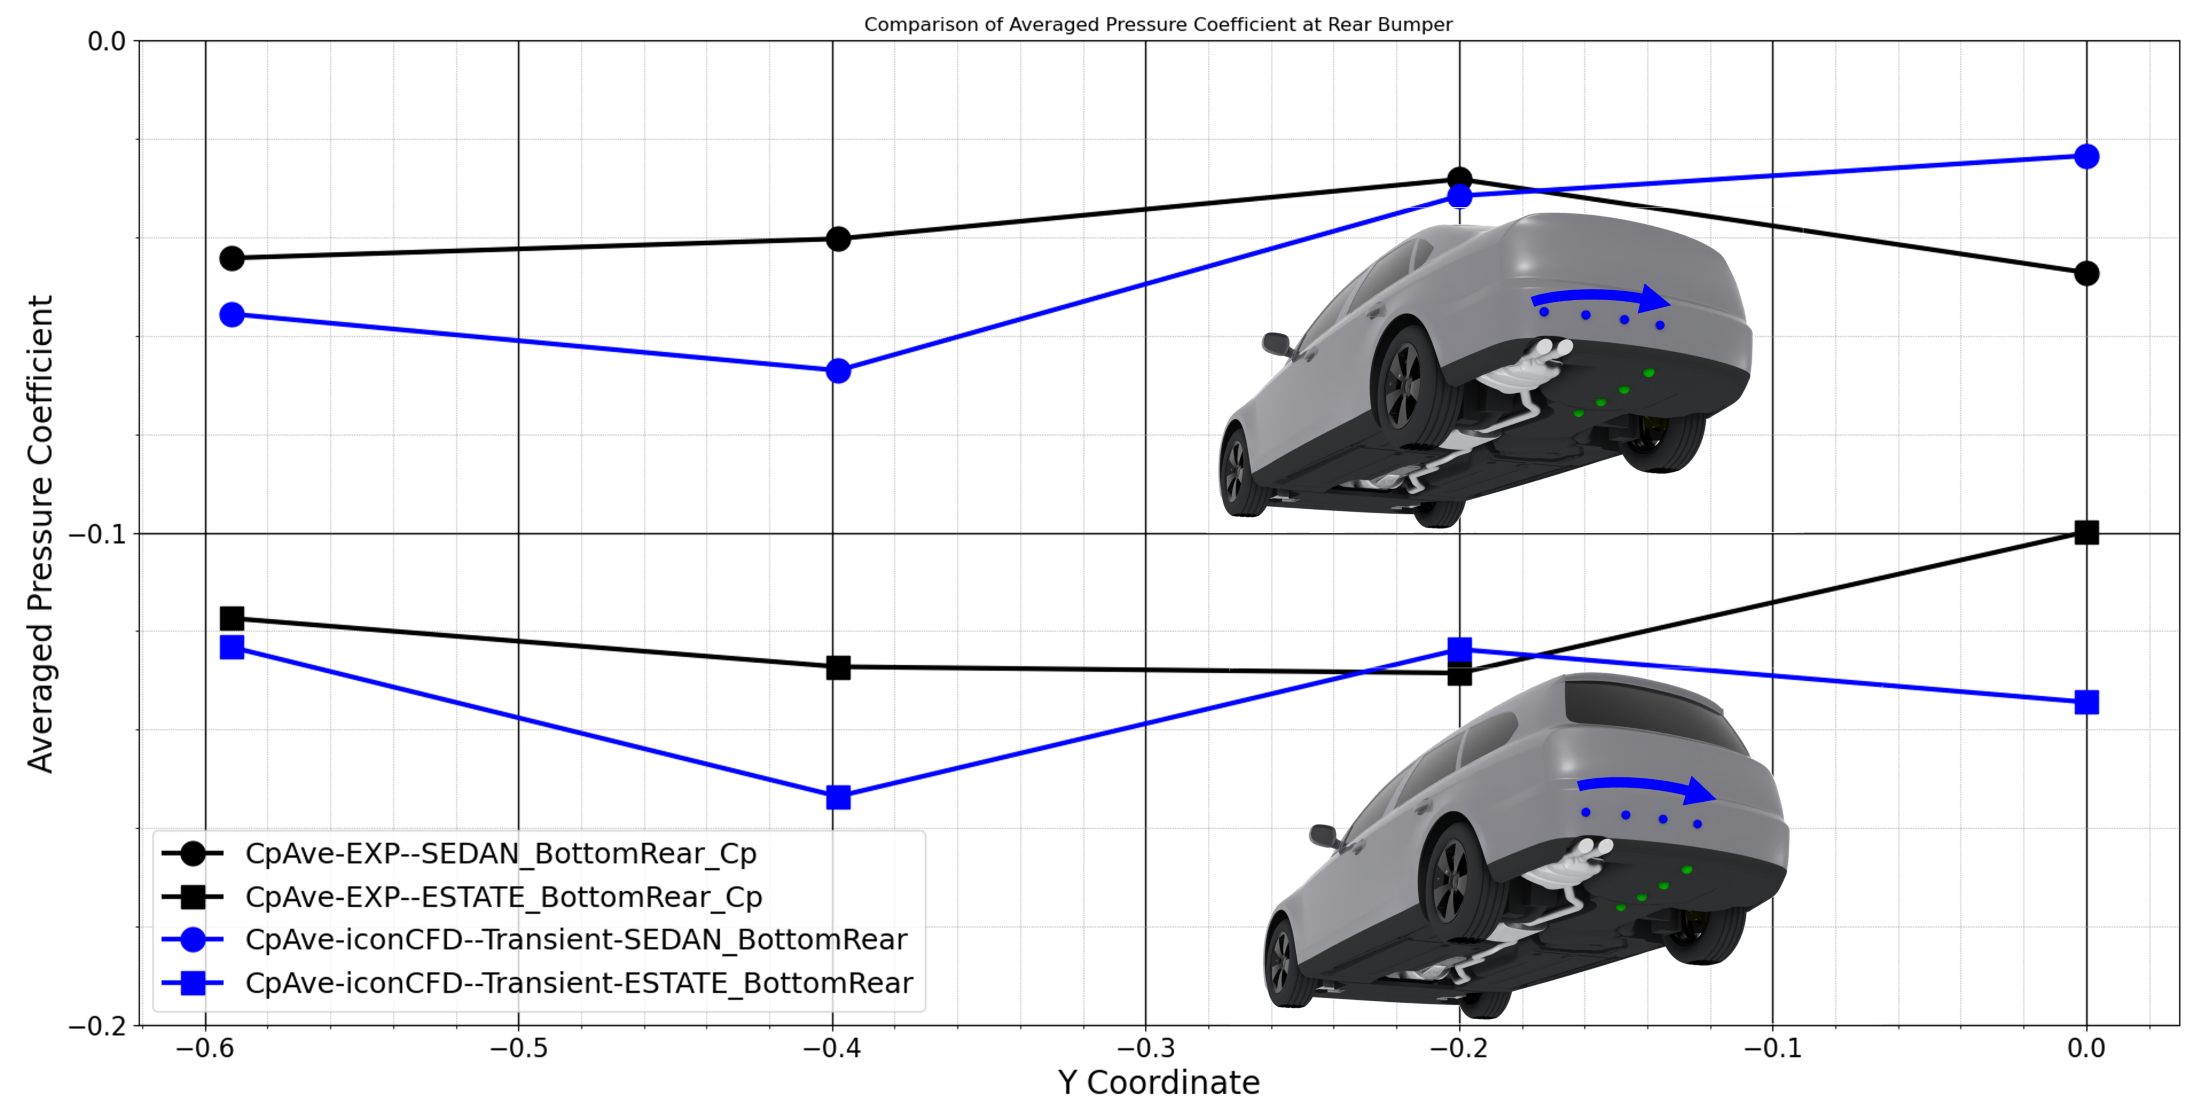
Figure 3: Comparison of time averaged pressure coefficient measured (black) and iconCFD® calculated (blue) on rear bumper of Sedan (circles) and Estate (squares).
Next, let’s shift our focus to the underbody—specifically, the pressure on the diffuser. Four probes were positioned along the diffuser centerline, indicated by green points in Figure 2. Experimental pressure data measured on the diffuser (shown in black) are compared with iconCFD® simulation results (shown in green) in the figure below. The horizontal axis of the chart represents the X-coordinate, with the origin at the midpoint between the front and rear axles.
The curves clearly illustrate how pressure on the diffuser increases toward the rear of the car. The positive (adverse) pressure gradient—the slope of the curves—is similar for both the Sedan and Estate configurations and is accurately predicted by iconCFD. Although the pressure gradients are comparable, the pressure values for the Sedan (represented by black and green circles) are consistently higher at all four locations along the diffuser compared to the Estate (black and green squares). This confirms that the lower pressure in the Estate wake, which we observed on the rear bumper, extends also into the diffuser region. The pressure difference between the Sedan and Estate on the diffuser (distance between squares and circles) is about 0.1 Cp in the experiment and it is also accurately predicted by iconCFD®.
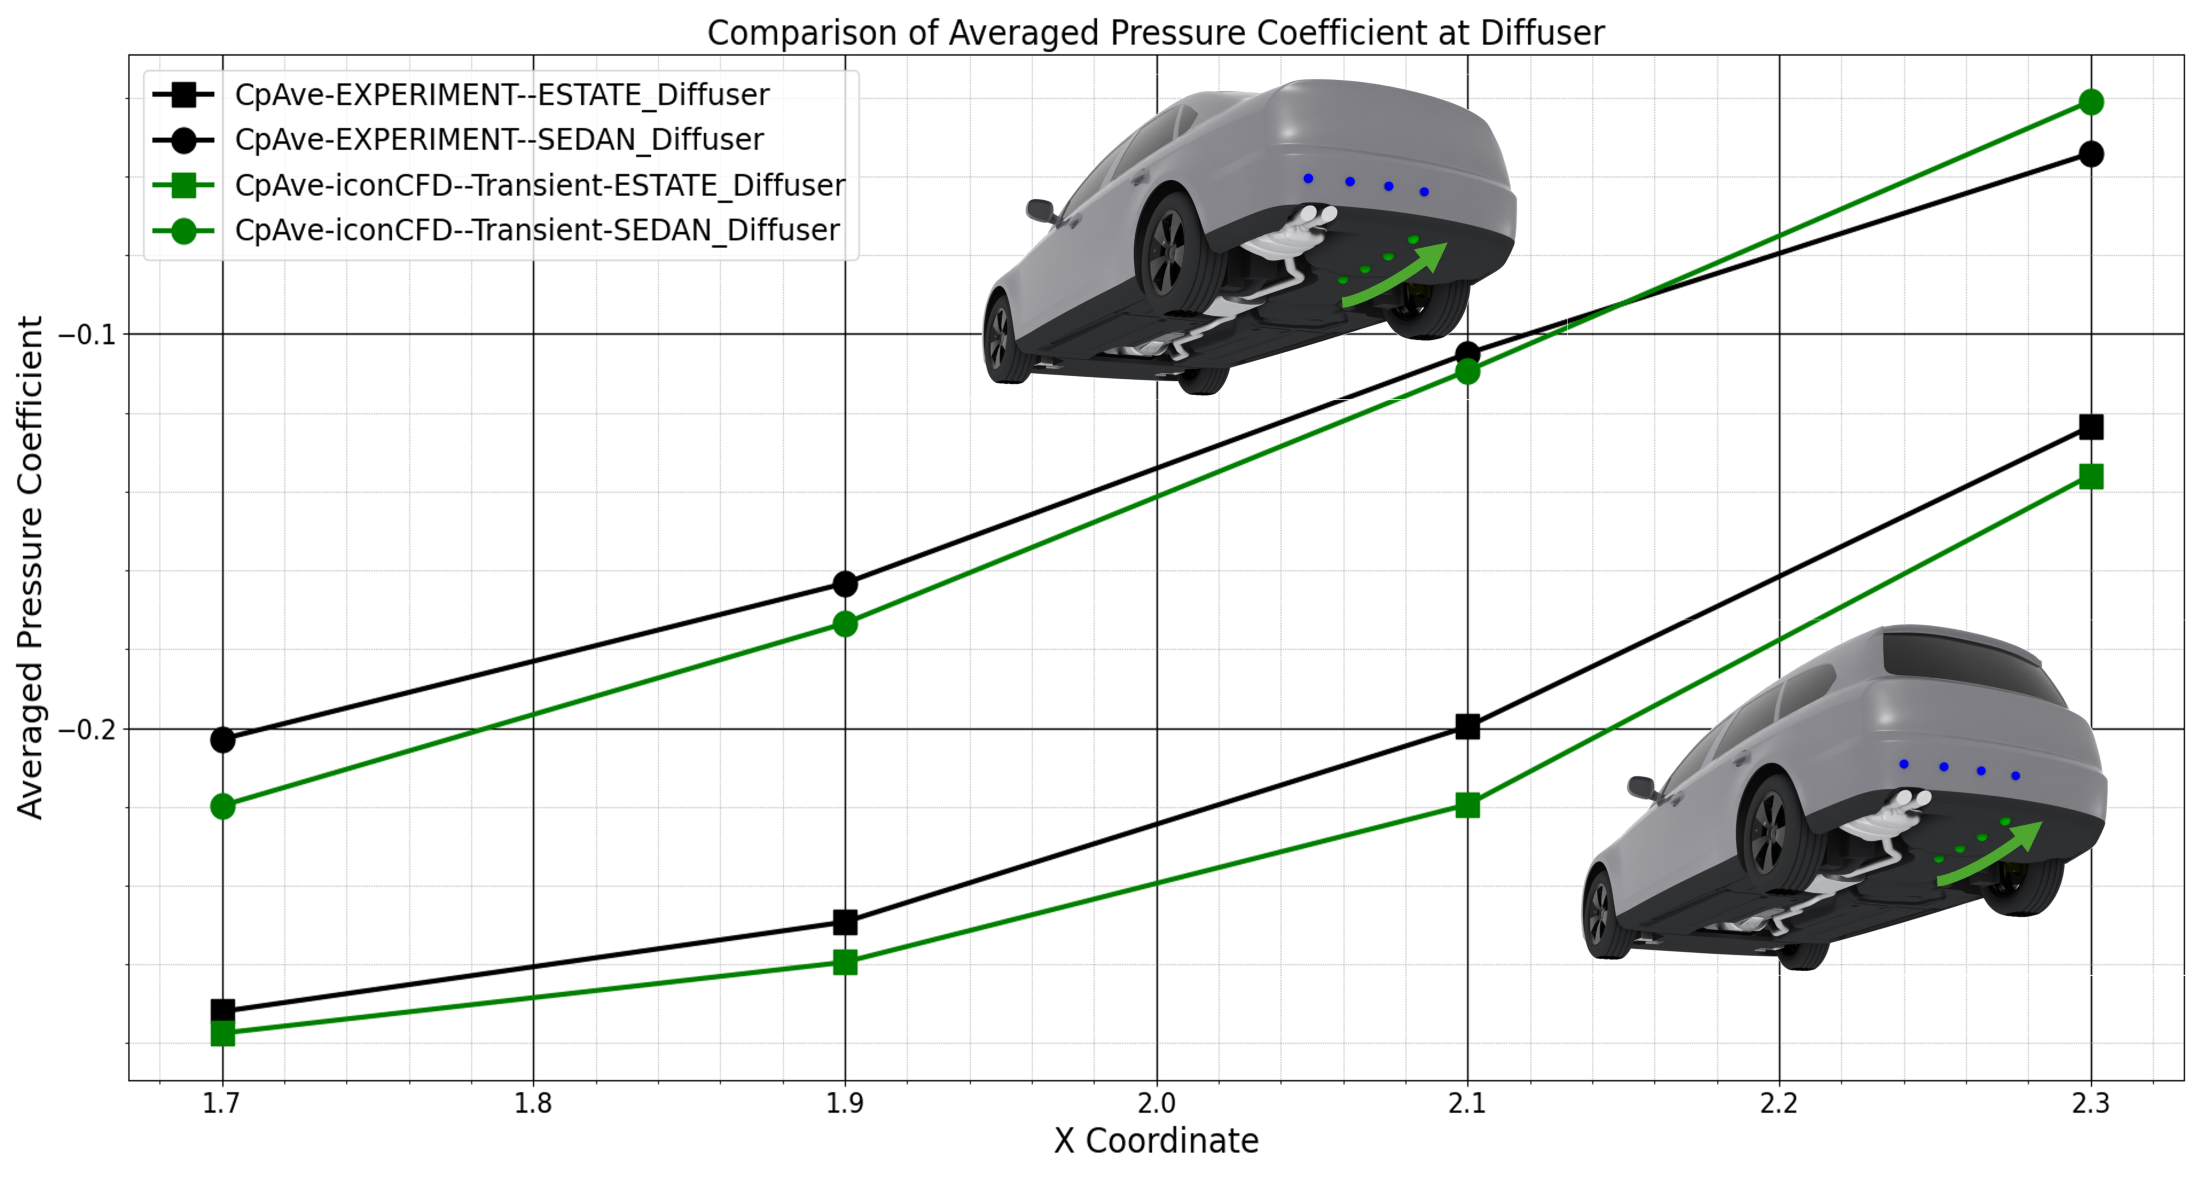
Figure 4: Comparison of time averaged pressure coefficient measured (black) and iconCFD® calculated (green) on diffuser of Sedan (circles) and Estate (squares).
The comparison of wind tunnel experimental pressure data with simulation results confirms that iconCFD® in transient mode accurately predicts wake pressure, diffuser pressure and its gradient, as well as the pressure variations caused by different rear body shapes.
If you are interested in discovering more about iconCFD®’s unique simulation capabilities for industrial automotive applications, please contact us here: Automotive Aerodynamics.
Acknowledgement:
The DrivAer car model developed by the Technical University of Munich (TUM) was used in this study. The model is described in detail by Heft et al. (2012).
© ICON 2025. All rights reserved. | Legal | Website by FocusedCRE