
At ICON Technology & Process Consulting, we continually develop and refine tools that enhance the efficiency, scalability, and accessibility of engineering simulations. One such solution is our iconPlatform — a browser-based environment designed to streamline the setup, execution, and analysis of simulation workflows.
iconPlatform provides a unified interface that integrates data management (object store), applications and ressources orchestration, process monitoring and post-processing exploration within a single web application.
This platform enables users to fully handle their simulations directly from their browser, eliminating the need for local software installation. It can be used from our provided instances, or deployed and self hosted on your environment.
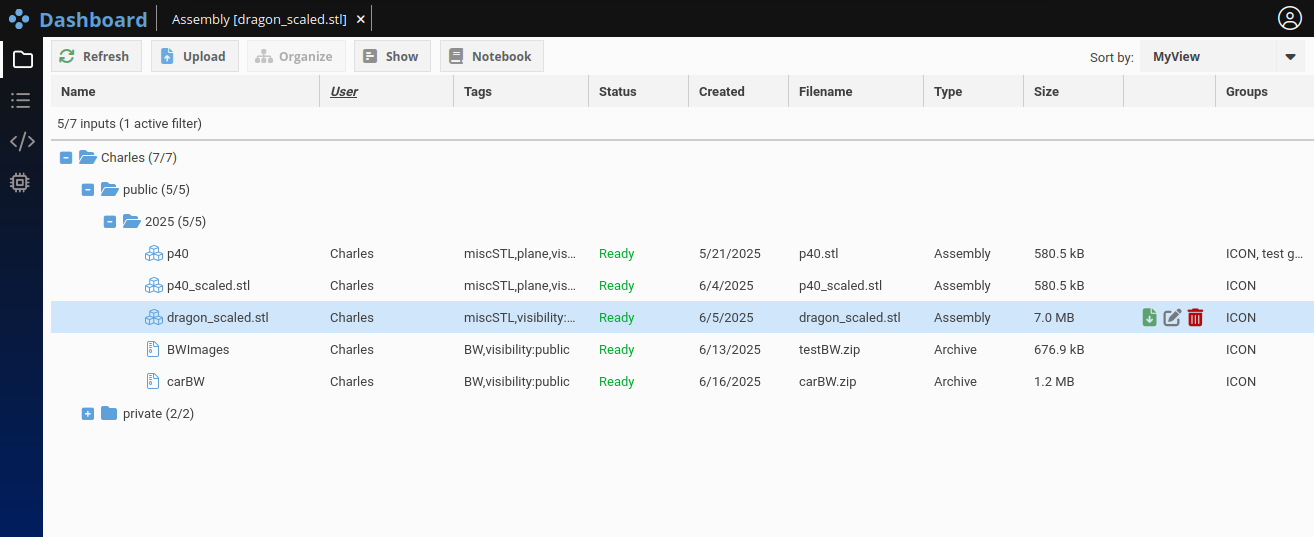
The Inputs tab allows users to upload, organize, and manage datasets that serve as inputs to simulation workflows. Any data can be uploaded here.
A built-in 3D viewer provides interactive exploration of geometries (like .stl and .obj files).
Tags are used as a flexible alternative to traditional folder hierarchies, allowing for more granular data classification and efficient retrieval in large-scale projects. More details will be provided in a future blog.
Within the Apps tab, users can manage their applications: processing bricks ranging from small helper tools to distributed solvers.
Each one is defined using a json file describing its requirements, entry point, and options so the user can configure each run as needed.
Applications can be deployed seamlessly across HPC system, leveraging Slurm, LSF, or any workload manager of your choice if needed.
The platform’s templating system exposes contextual metadata (e.g., simulation parameters, job IDs, environment variables), allowing information to flow in between chained applications.
The Process tab serves as the operational core of the Platform. Here, users combine Inputs and Apps to define workflows, allocate computational resources, and monitor execution in real time. As for the input tabs, processes can be label with tag and displayed using customer defined hierarchies, allowing to classify and filter a large amount of execution easily. The platform provides native integration with job schedulers, fully transparent to the end user.
Once the processing is done, users can leverage built-in visualization and analysis capabilities, including:
These visualization tools are optimized for both performance and usability, enabling rapid iteration between simulation setup and analysis.
The iconPlatform architecture is intentionally designed to minimize server-side overhead. Once primary compute tasks (such as mesher, solver runs or post-processing operations) are completed on target HPC clusters, subsequent analyses are executed client-side within the browser environment.
This approach ensures that no additional cluster connections or HPC resource allocations are required during case analysis, leading to more predictable compute costs and improved responsiveness for end users. As a result, engineers can interactively explore and analyze simulation results without incurring further server-side load or queue times.
A generic post-processing application designed to automate ParaView pipelines via lightweight JSON definitions is also available. It brings the full post-processing power of ParaView with a simple integration into iconPlatform.
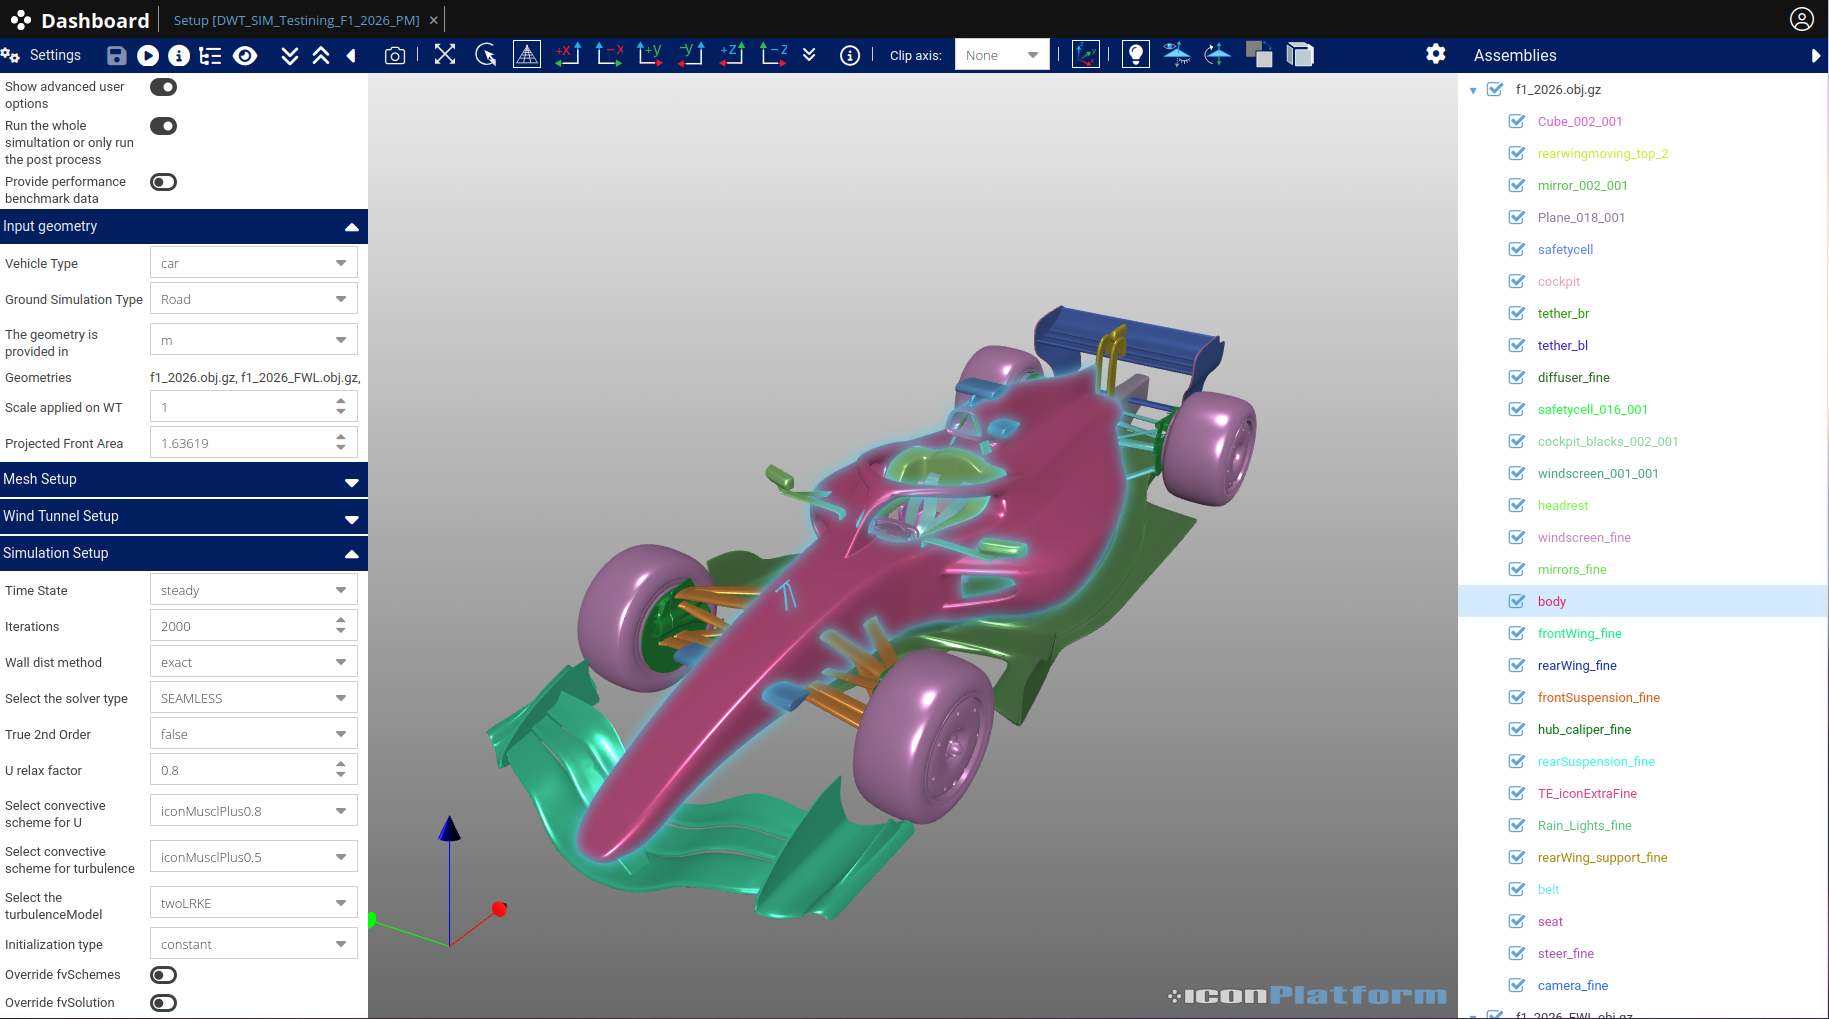
The CFD analysis showcased in this article was created entirely within iconPlatform, demonstrating the seamless integration between data management, computation, and visualization. iconPlatform is not limited to CFD workflows.
For more information regarding iconPlatform or iconCFD Post and how it can accelerate simulation workflows and productivity, contact us at:
https://www.iconcfd.com/contact-us/
© ICON 2025. All rights reserved. | Legal | Website by FocusedCRE